
The Real Problem: You’re Not Lazy, Your Workflow Is Broken
Most researchers think they’re disorganized. They’re not. They’re using 8-12 disconnected tools and expecting their brain to be the integration layer.
Here’s what that costs. With 5.14 million papers published every year in your field, you need discovery tools to find signal in the noise. So you start with Semantic Scholar or PubMed. Then you add a reference manager (Zotero or Mendeley). Then an AI screening tool for strategic reading (Fynman or SciSpace). Then a note-taking app so insights don’t die in PDF annotations (Obsidian or OneNote). Then a writing tool (Word, Google Docs, or LaTeX). Then analysis software (SPSS, R, or Python). Then presentation software (PowerPoint, Canva, or BioRender).
You’ve now switched contexts 7+ times per research cycle. Each context switch costs 15-20 minutes of refocus time. A researcher spending 20 hours a week on research loses roughly 6 hours per week to context switching alone. Across a 12-week semester, that’s 72 hours—nearly two full weeks of work—spent not on research, but on switching between tools.
That’s the 30% productivity loss researchers see across the entire lifecycle.
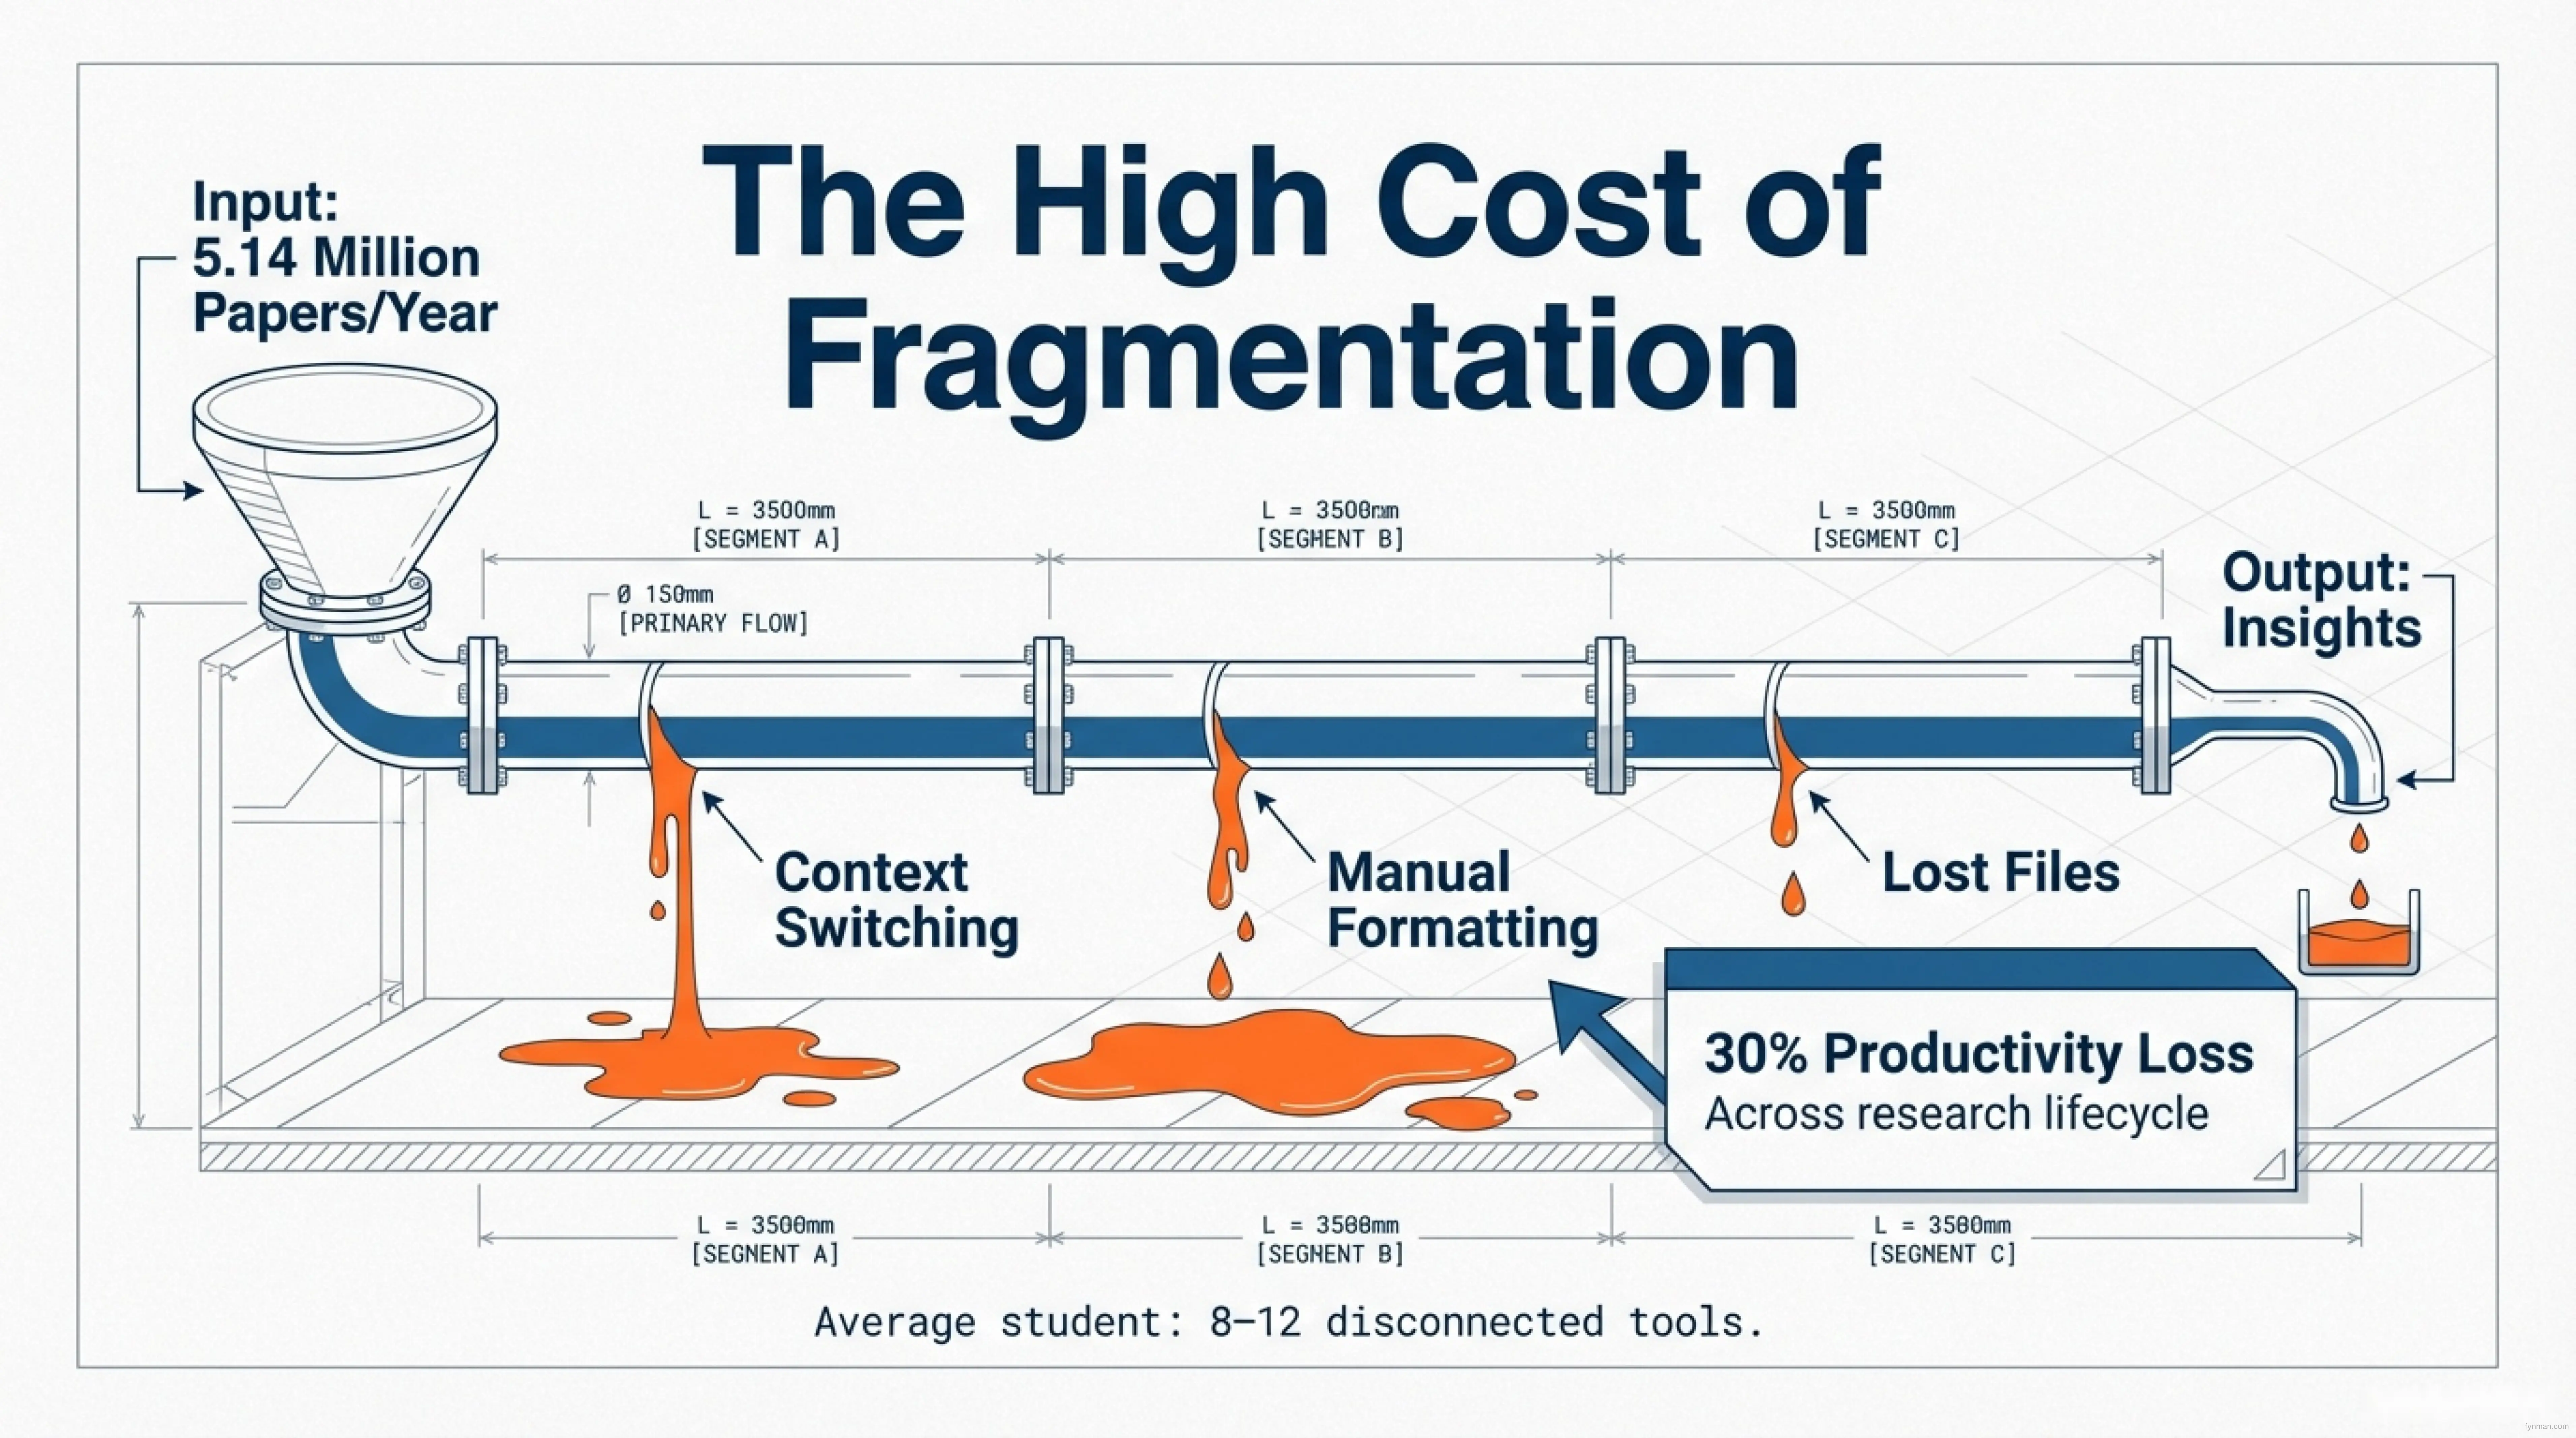
But here’s the thing: You don’t have an organization problem. You have an architecture problem.
The Mindset Shift That Changes Everything
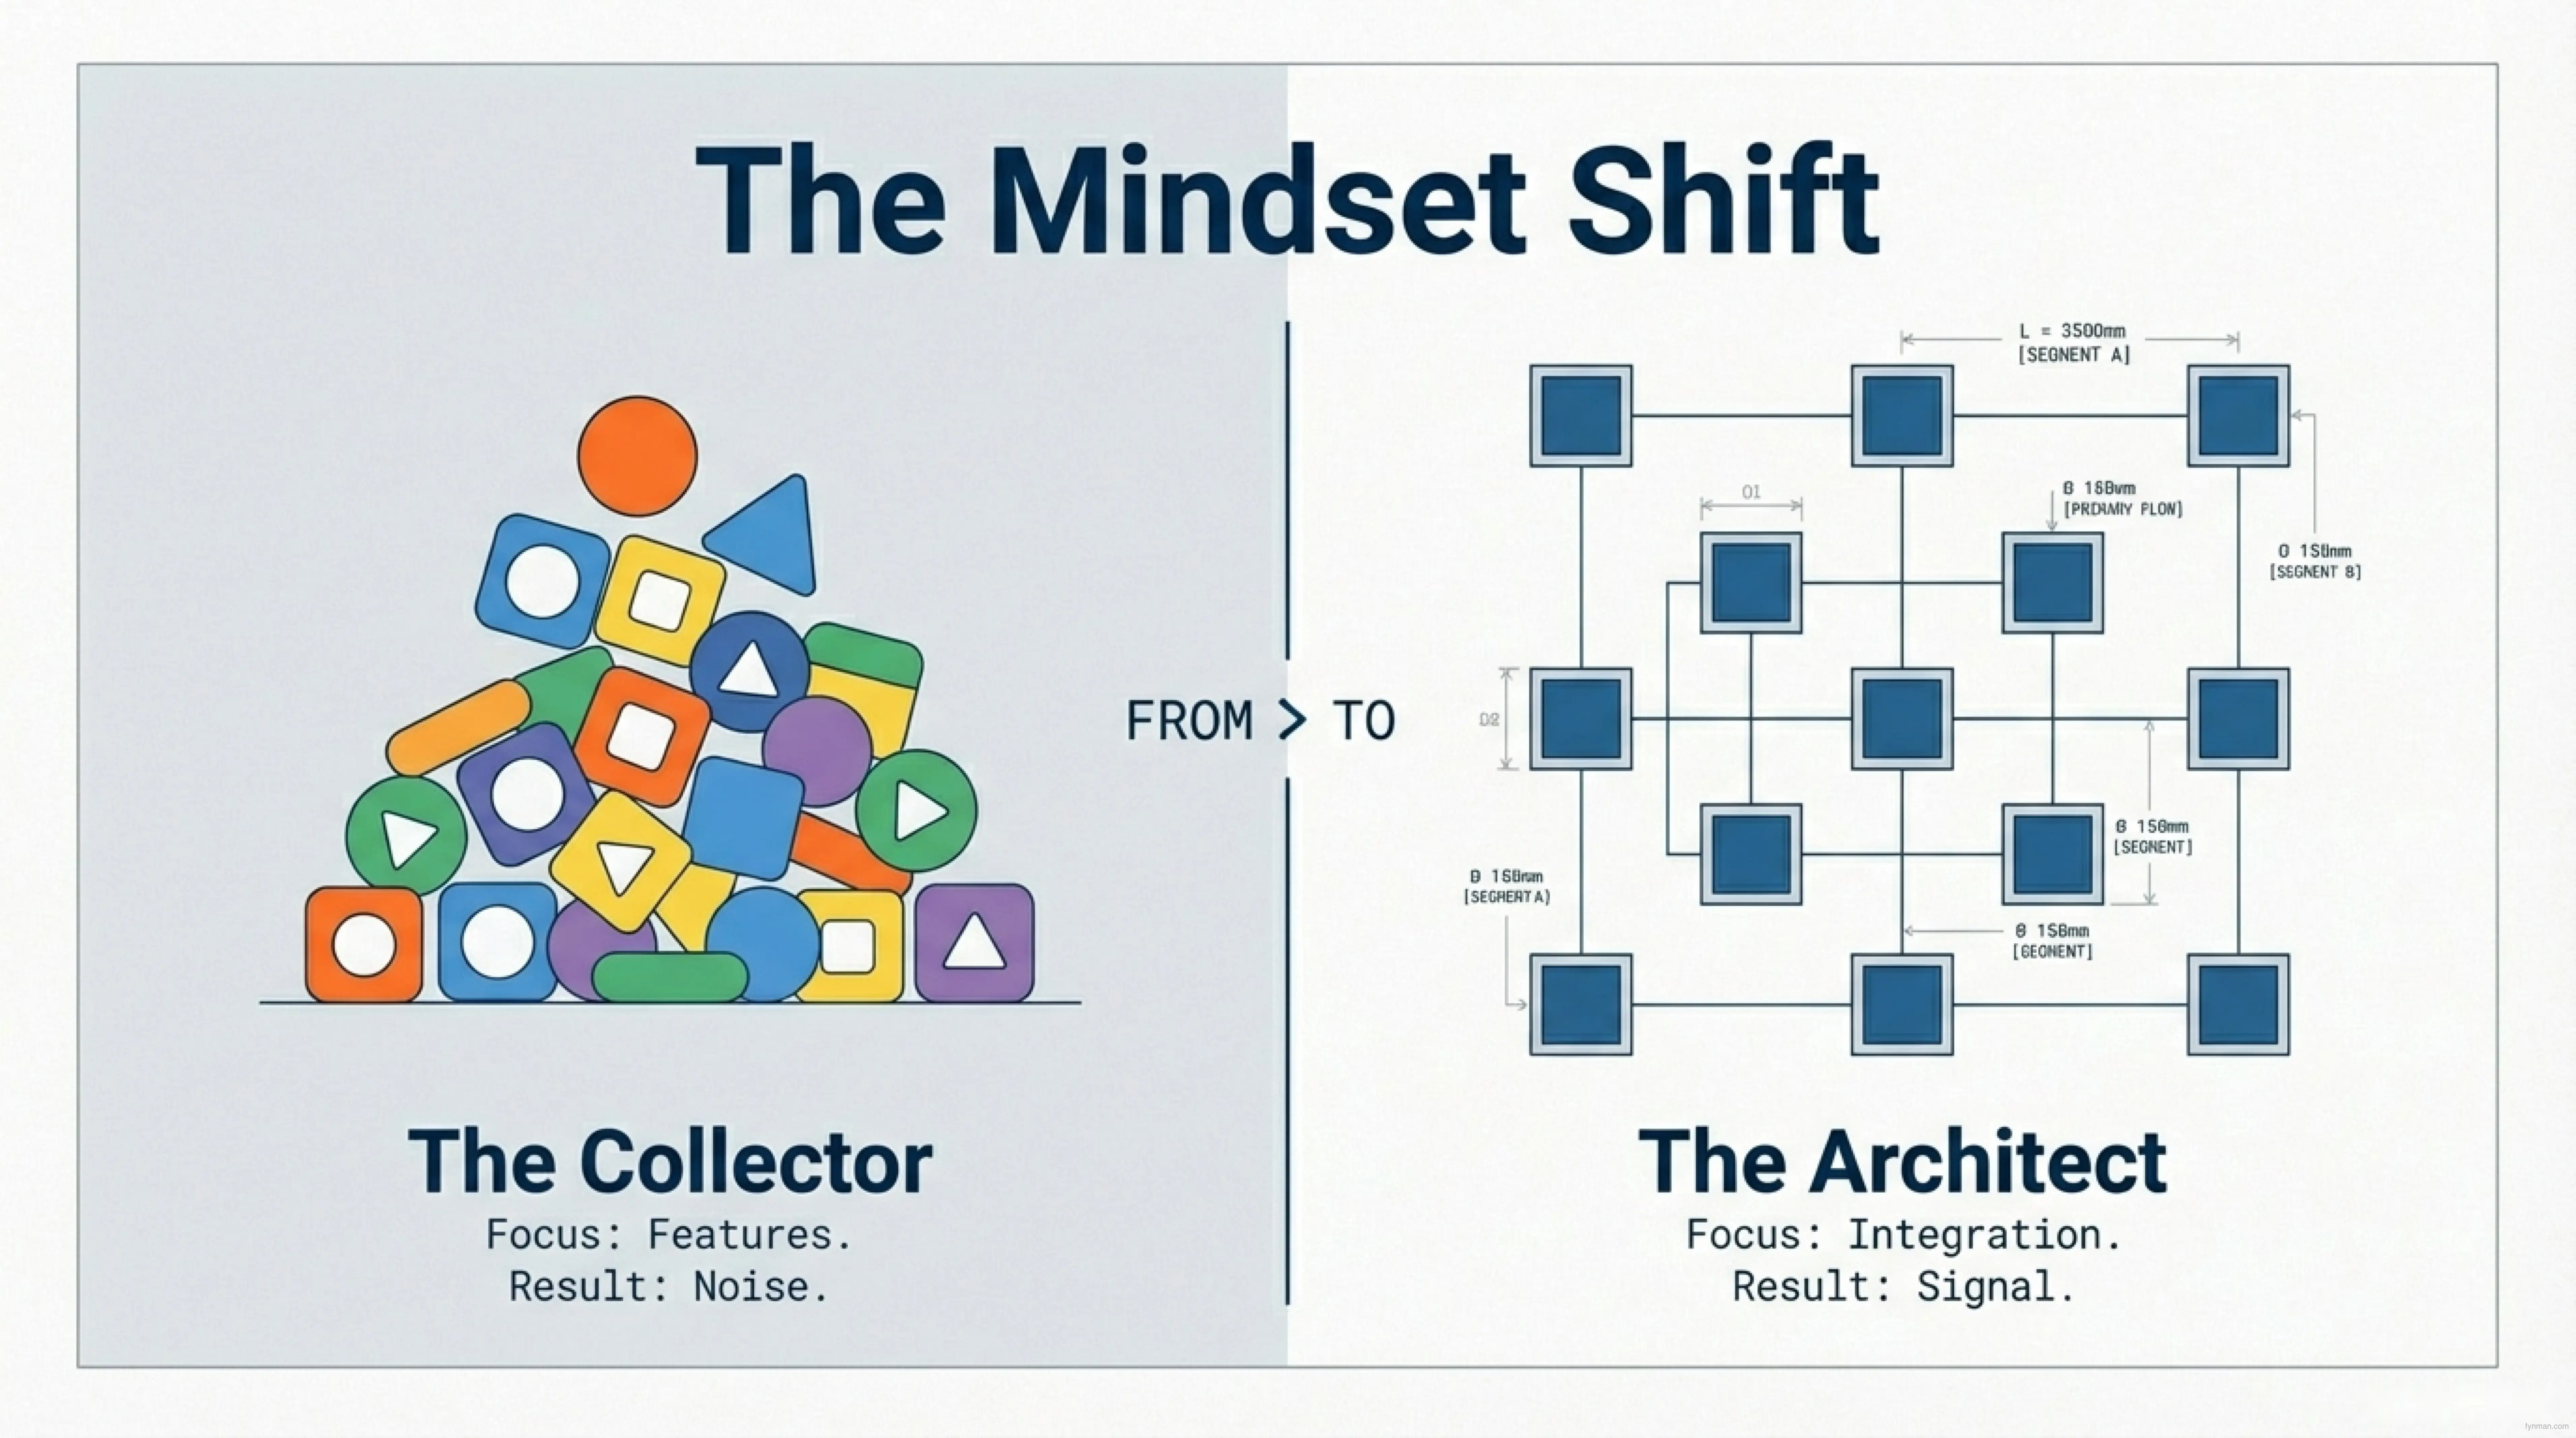
There are two ways to approach research tools.
The Collector focuses on features. Each new tool feels like progress. “Oh, this app tags PDFs? Great, I’ll add it.” But 12 tools later, you’re spending more time managing tools than doing research. The result: context switching, feature bloat, and insights scattered across disconnected apps. The Collector produces noise.
The Architect focuses on connection and resilience. The question isn’t “What features do I want?” but rather “How do these tools talk to each other—and will they still work in six months?” The output is a system where one stage feeds seamlessly into the next. Less friction. More flow. Insights preserved and synthesized. The Architect produces signal.
The Architect mindset is harder upfront because it requires asking uncomfortable questions: Does this tool export in a standard format? Can the next tool read it? Is the handoff automatic or manual? Will this tool still be maintained in two years? Most tools fail these questions. That’s okay. Knowing they fail is the point—it means you’re choosing wisely instead of collecting indiscriminately.
The best tool is the one that disappears into your workflow. You don’t think about it. It doesn’t get in your way. It just works. And it will still work tomorrow.
The 7-Stage Research Ecosystem: A Closed Loop from Discovery to Publication
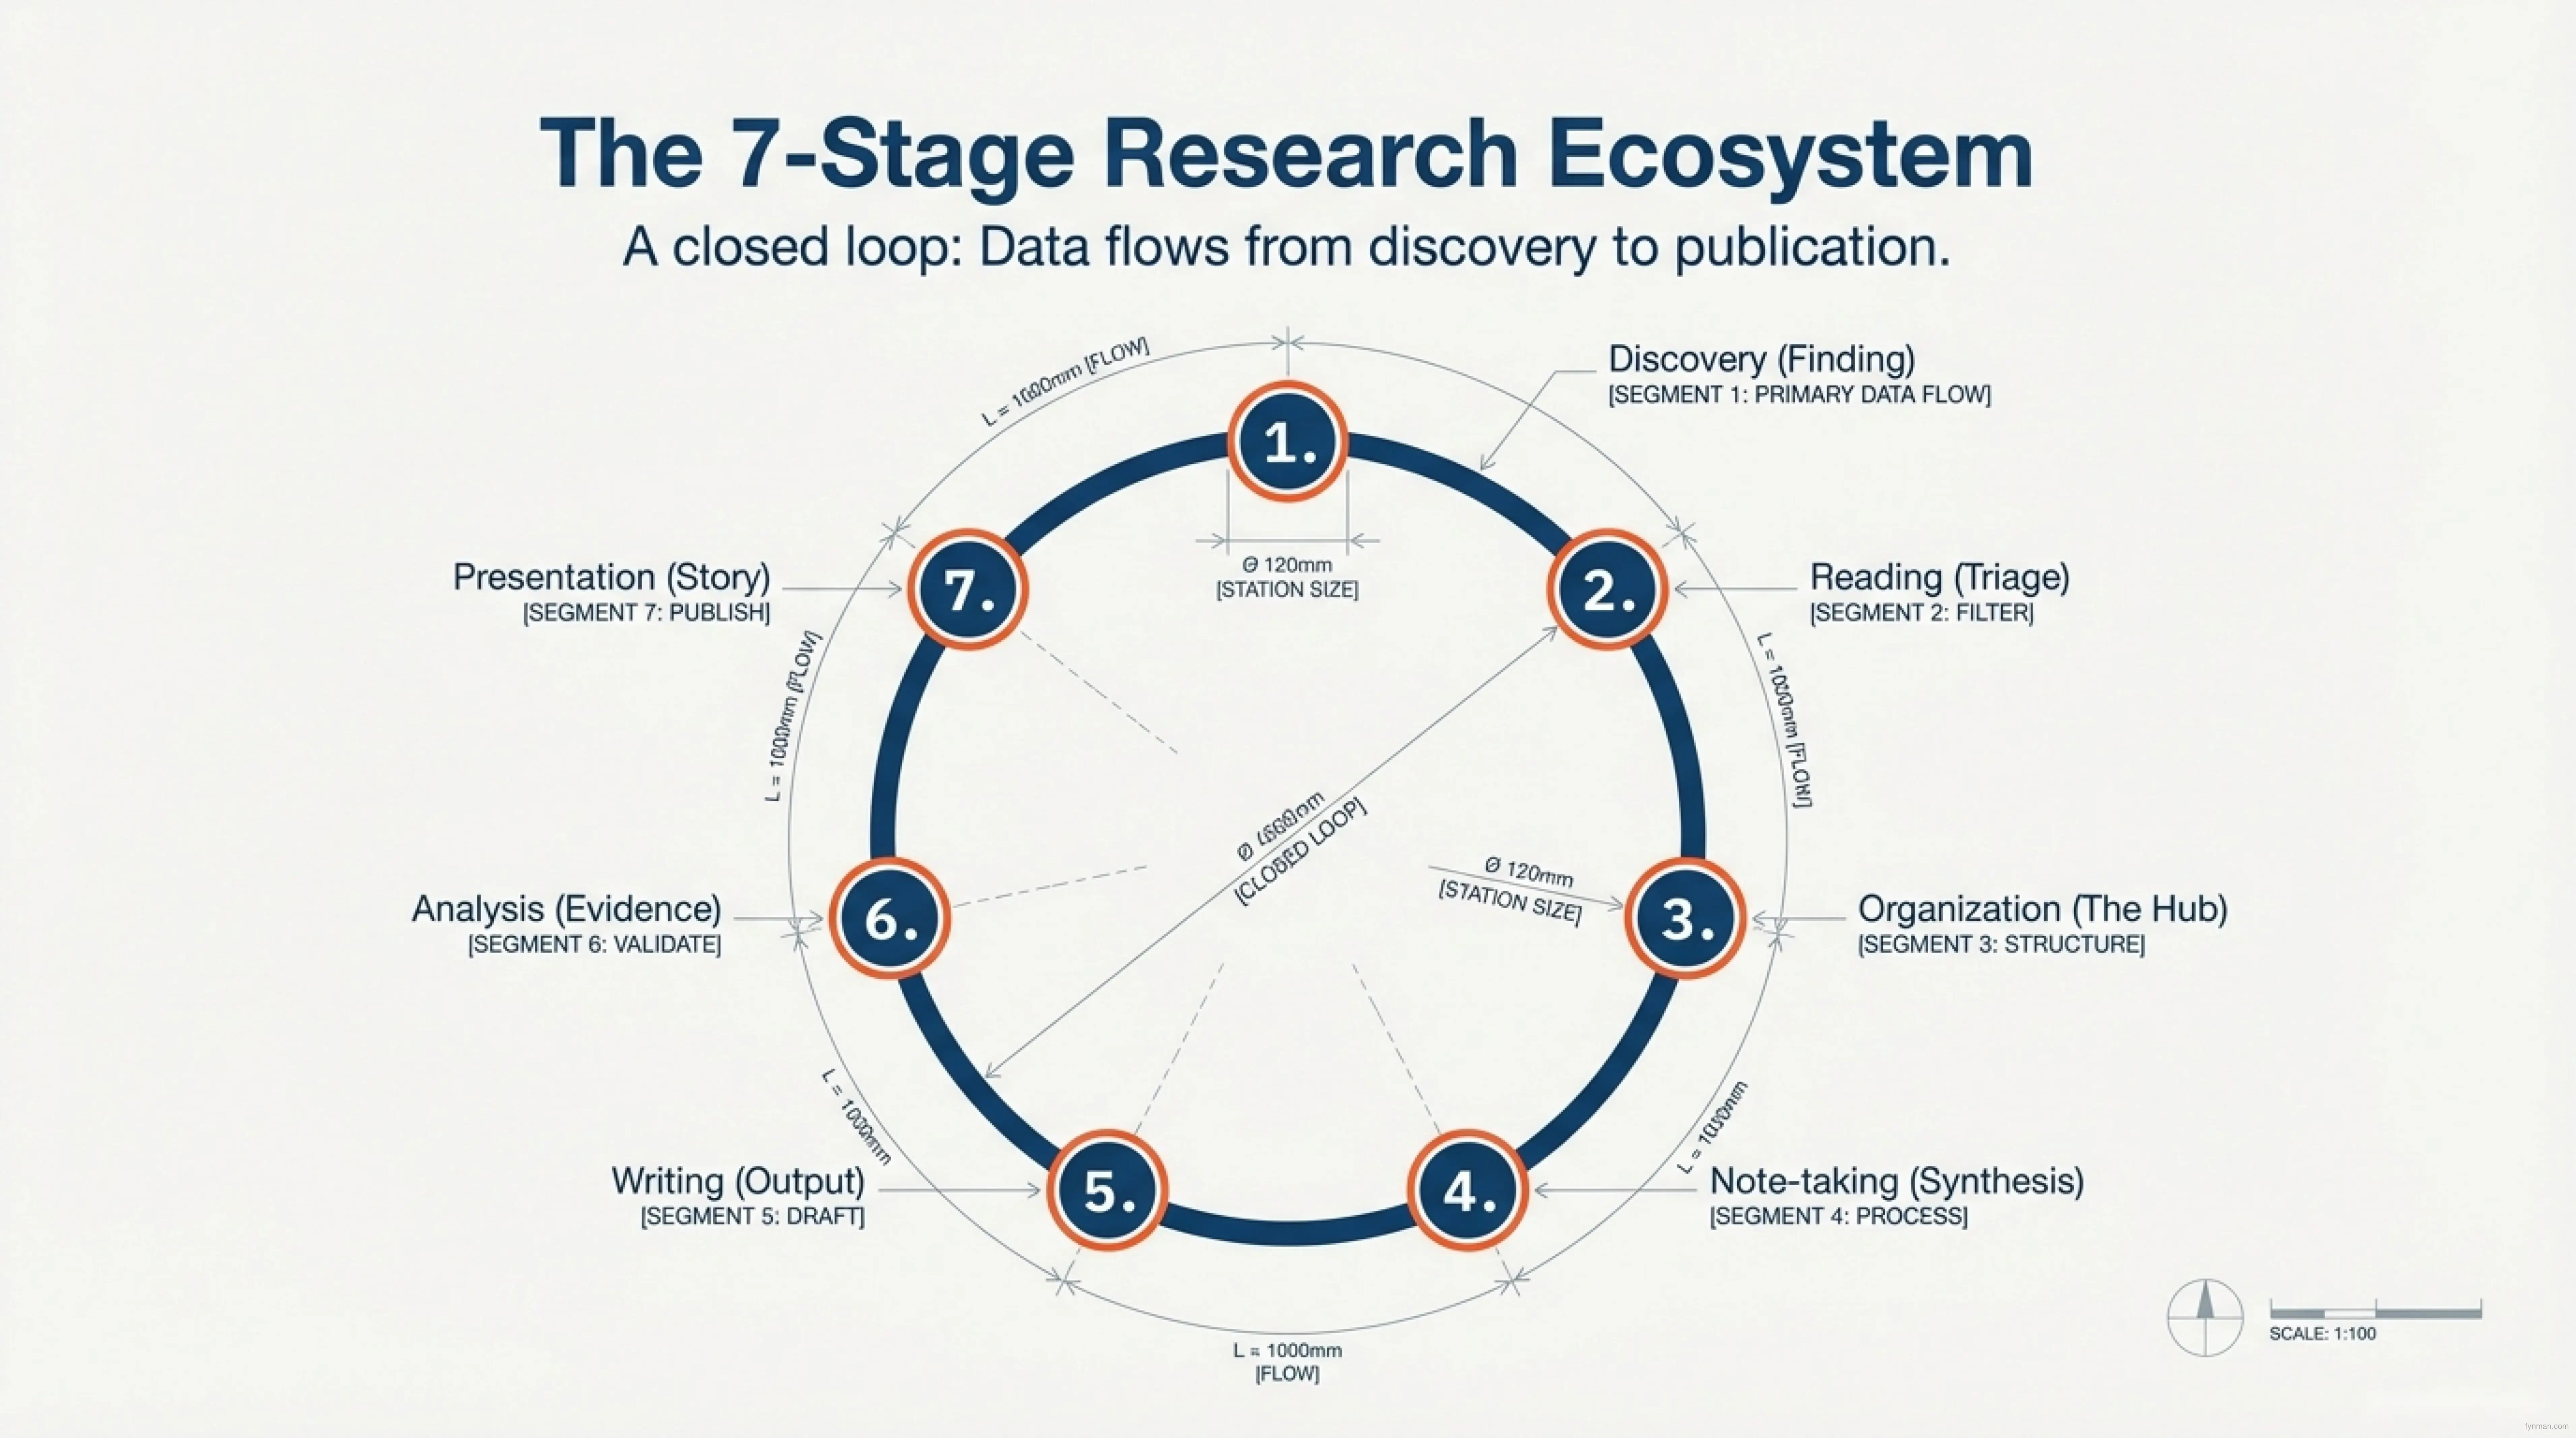
This is the framework. Think of it like a manufacturing pipeline, except the input is curiosity and the output is knowledge.
Each stage has a specific job. Skip a stage and you’ll feel the friction. Rush through a stage and you’ll regret it later.
Stage 1: Discovery — Find the Signal, Not Just Keywords
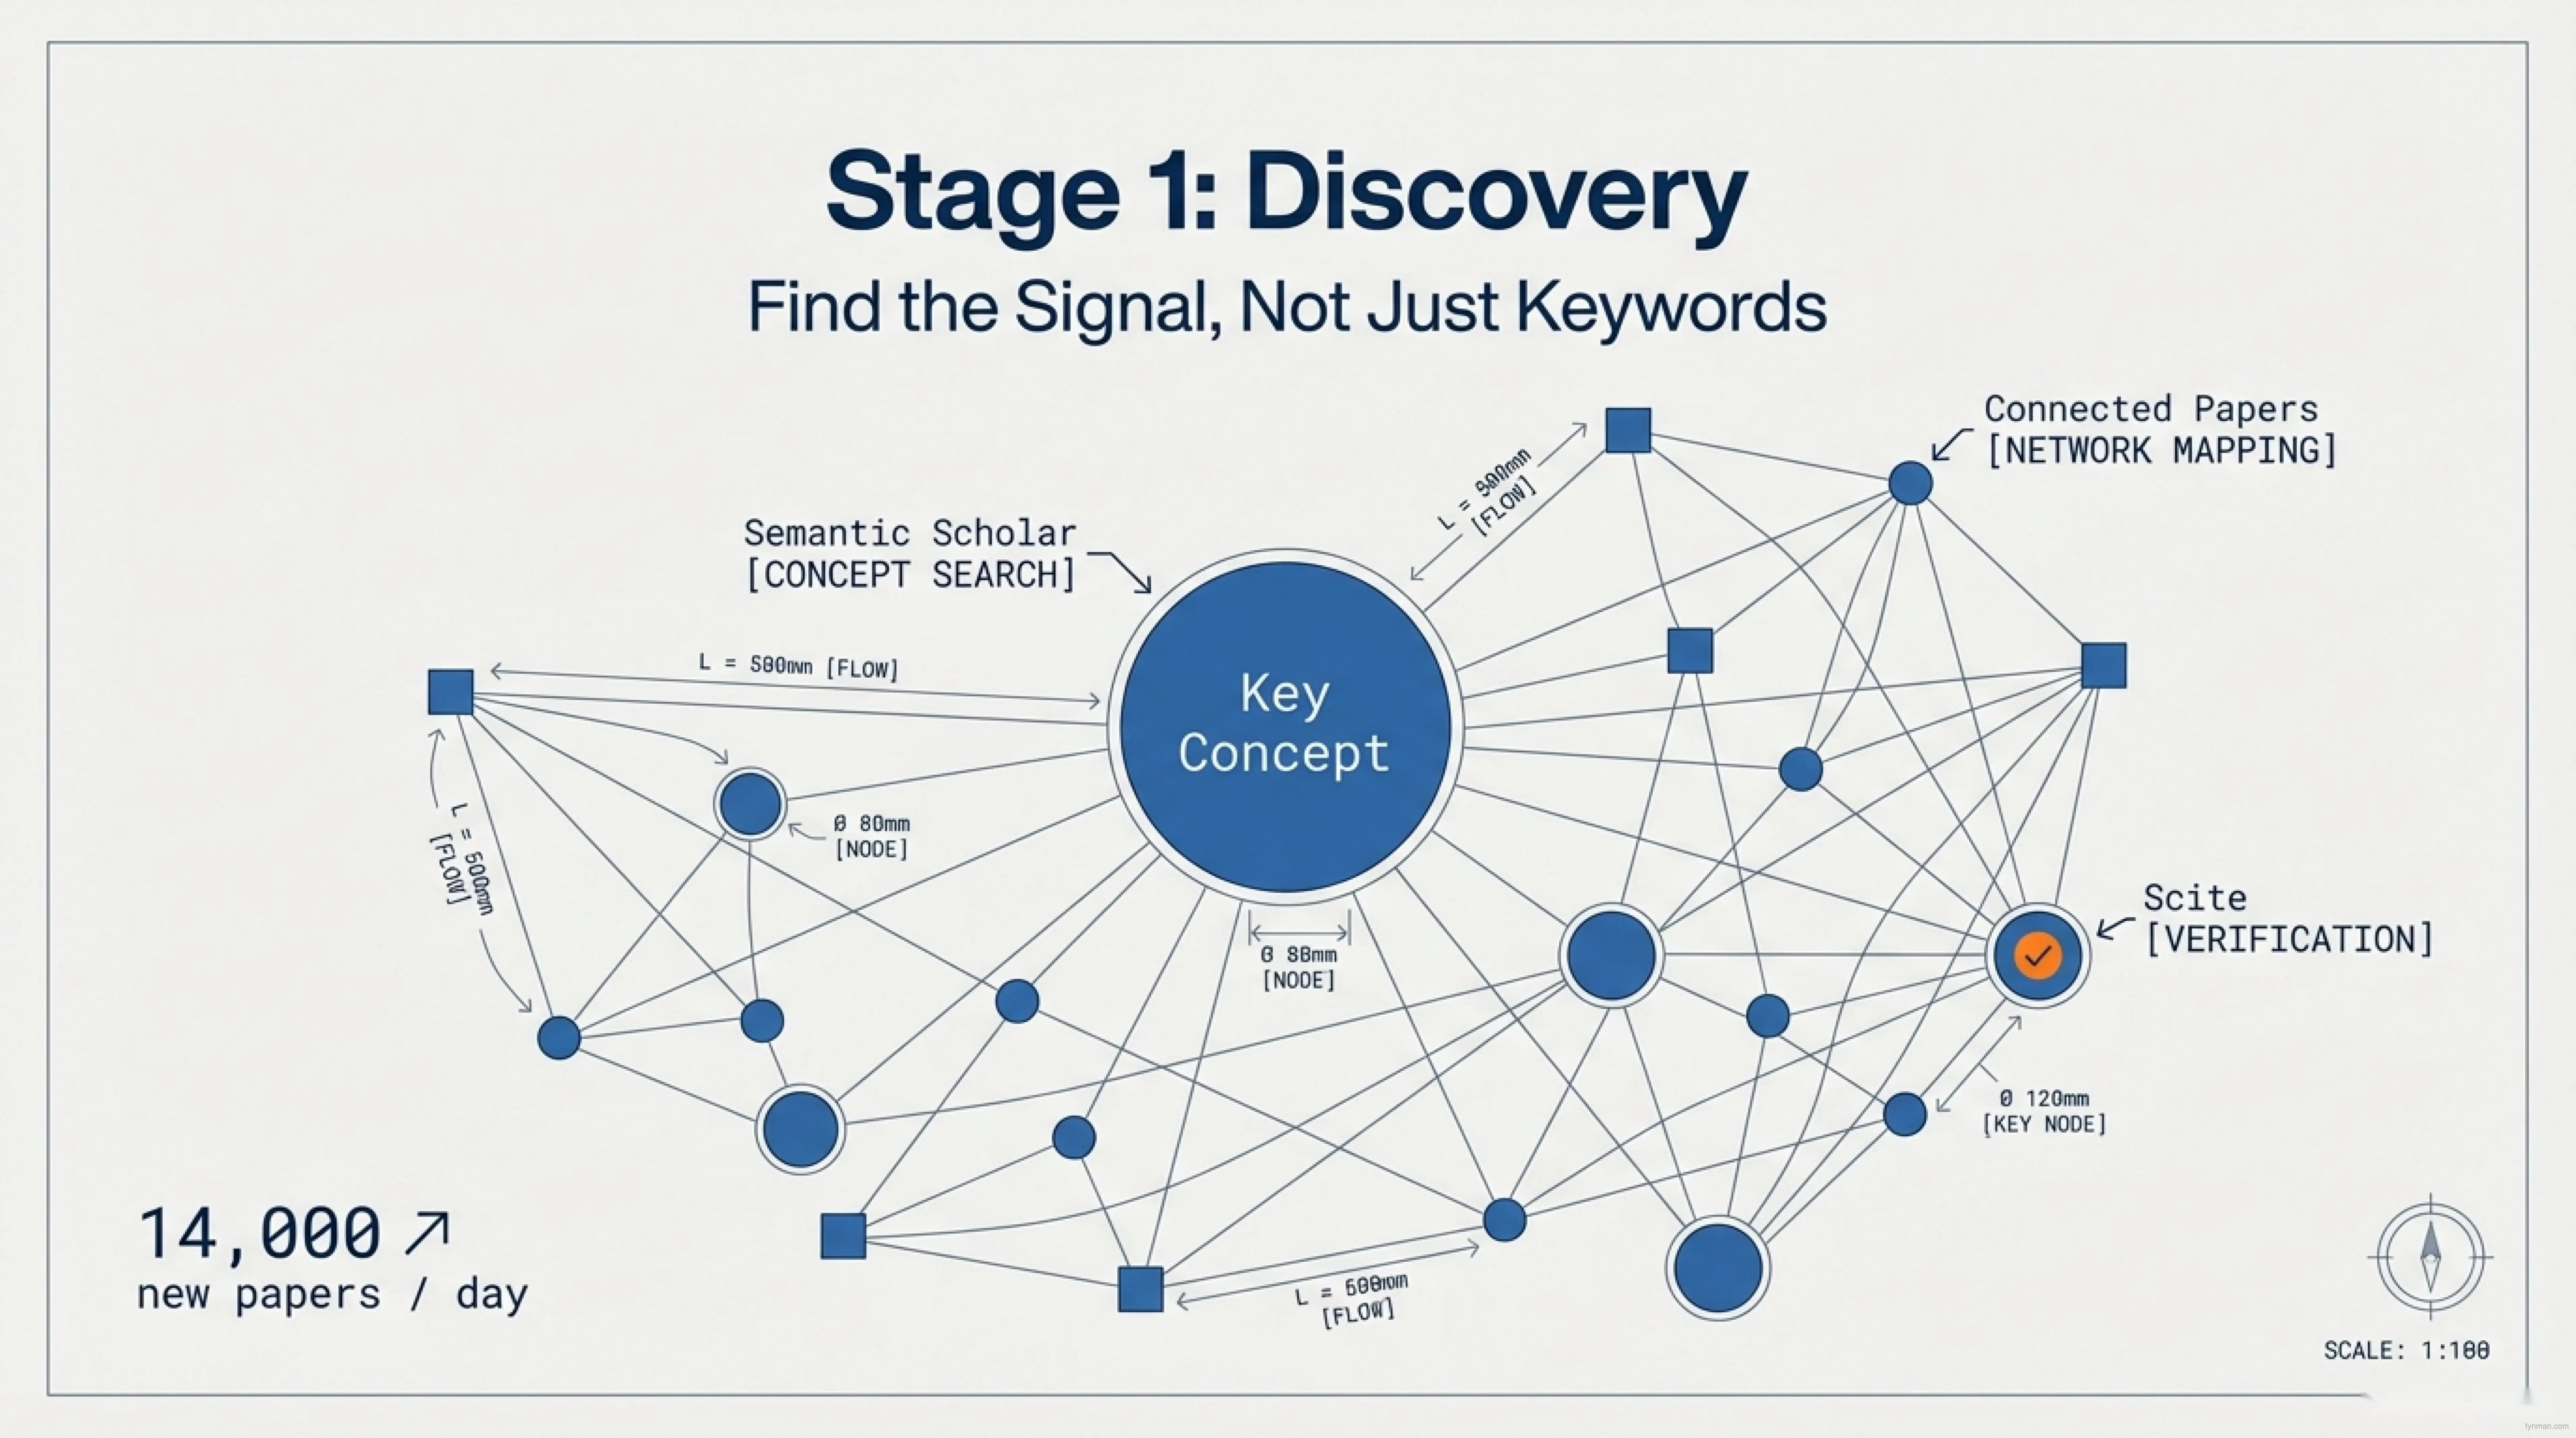
You have 14,000 new papers published every day in your field. You can’t read them all. You need to find the right ones. This is about finding signal—the papers that matter—not drowning in noise.
Keyword searches are a start, but they’re blunt tools. Searching “machine learning in biology” returns 50,000 papers, most tangentially related. You’ll waste weeks filtering noise instead of reading signal.
The architectural approach: Use semantic search tools that understand concepts, not just words. Semantic Scholar and PubMed cluster papers by meaning, not keywords. Then map the network—Connected Papers shows which papers are cited together, which authors collaborate, and which concepts cluster. This network view reveals the intellectual structure of your field.
Once you identify a key concept in your subfield, you’re no longer searching blindly. You’re following a map. The central papers (highest citation density) are your signal. The peripheral papers are noise.
The tools: Semantic Scholar (free), Connected Papers (free), or PubMed for biomedical literature.
The handoff: Export a curated list of the 50 most relevant papers to your reference manager (next stage).
Real scenario: Instead of searching broadly and getting lost, you start with one seminal paper. Connected Papers shows you the 50 papers it’s most related to. You identify the 5 most cited papers in that cluster. Those are your signal. Everything else is noise to be evaluated later.
Stage 2: Reading — Triage vs. Deep Work
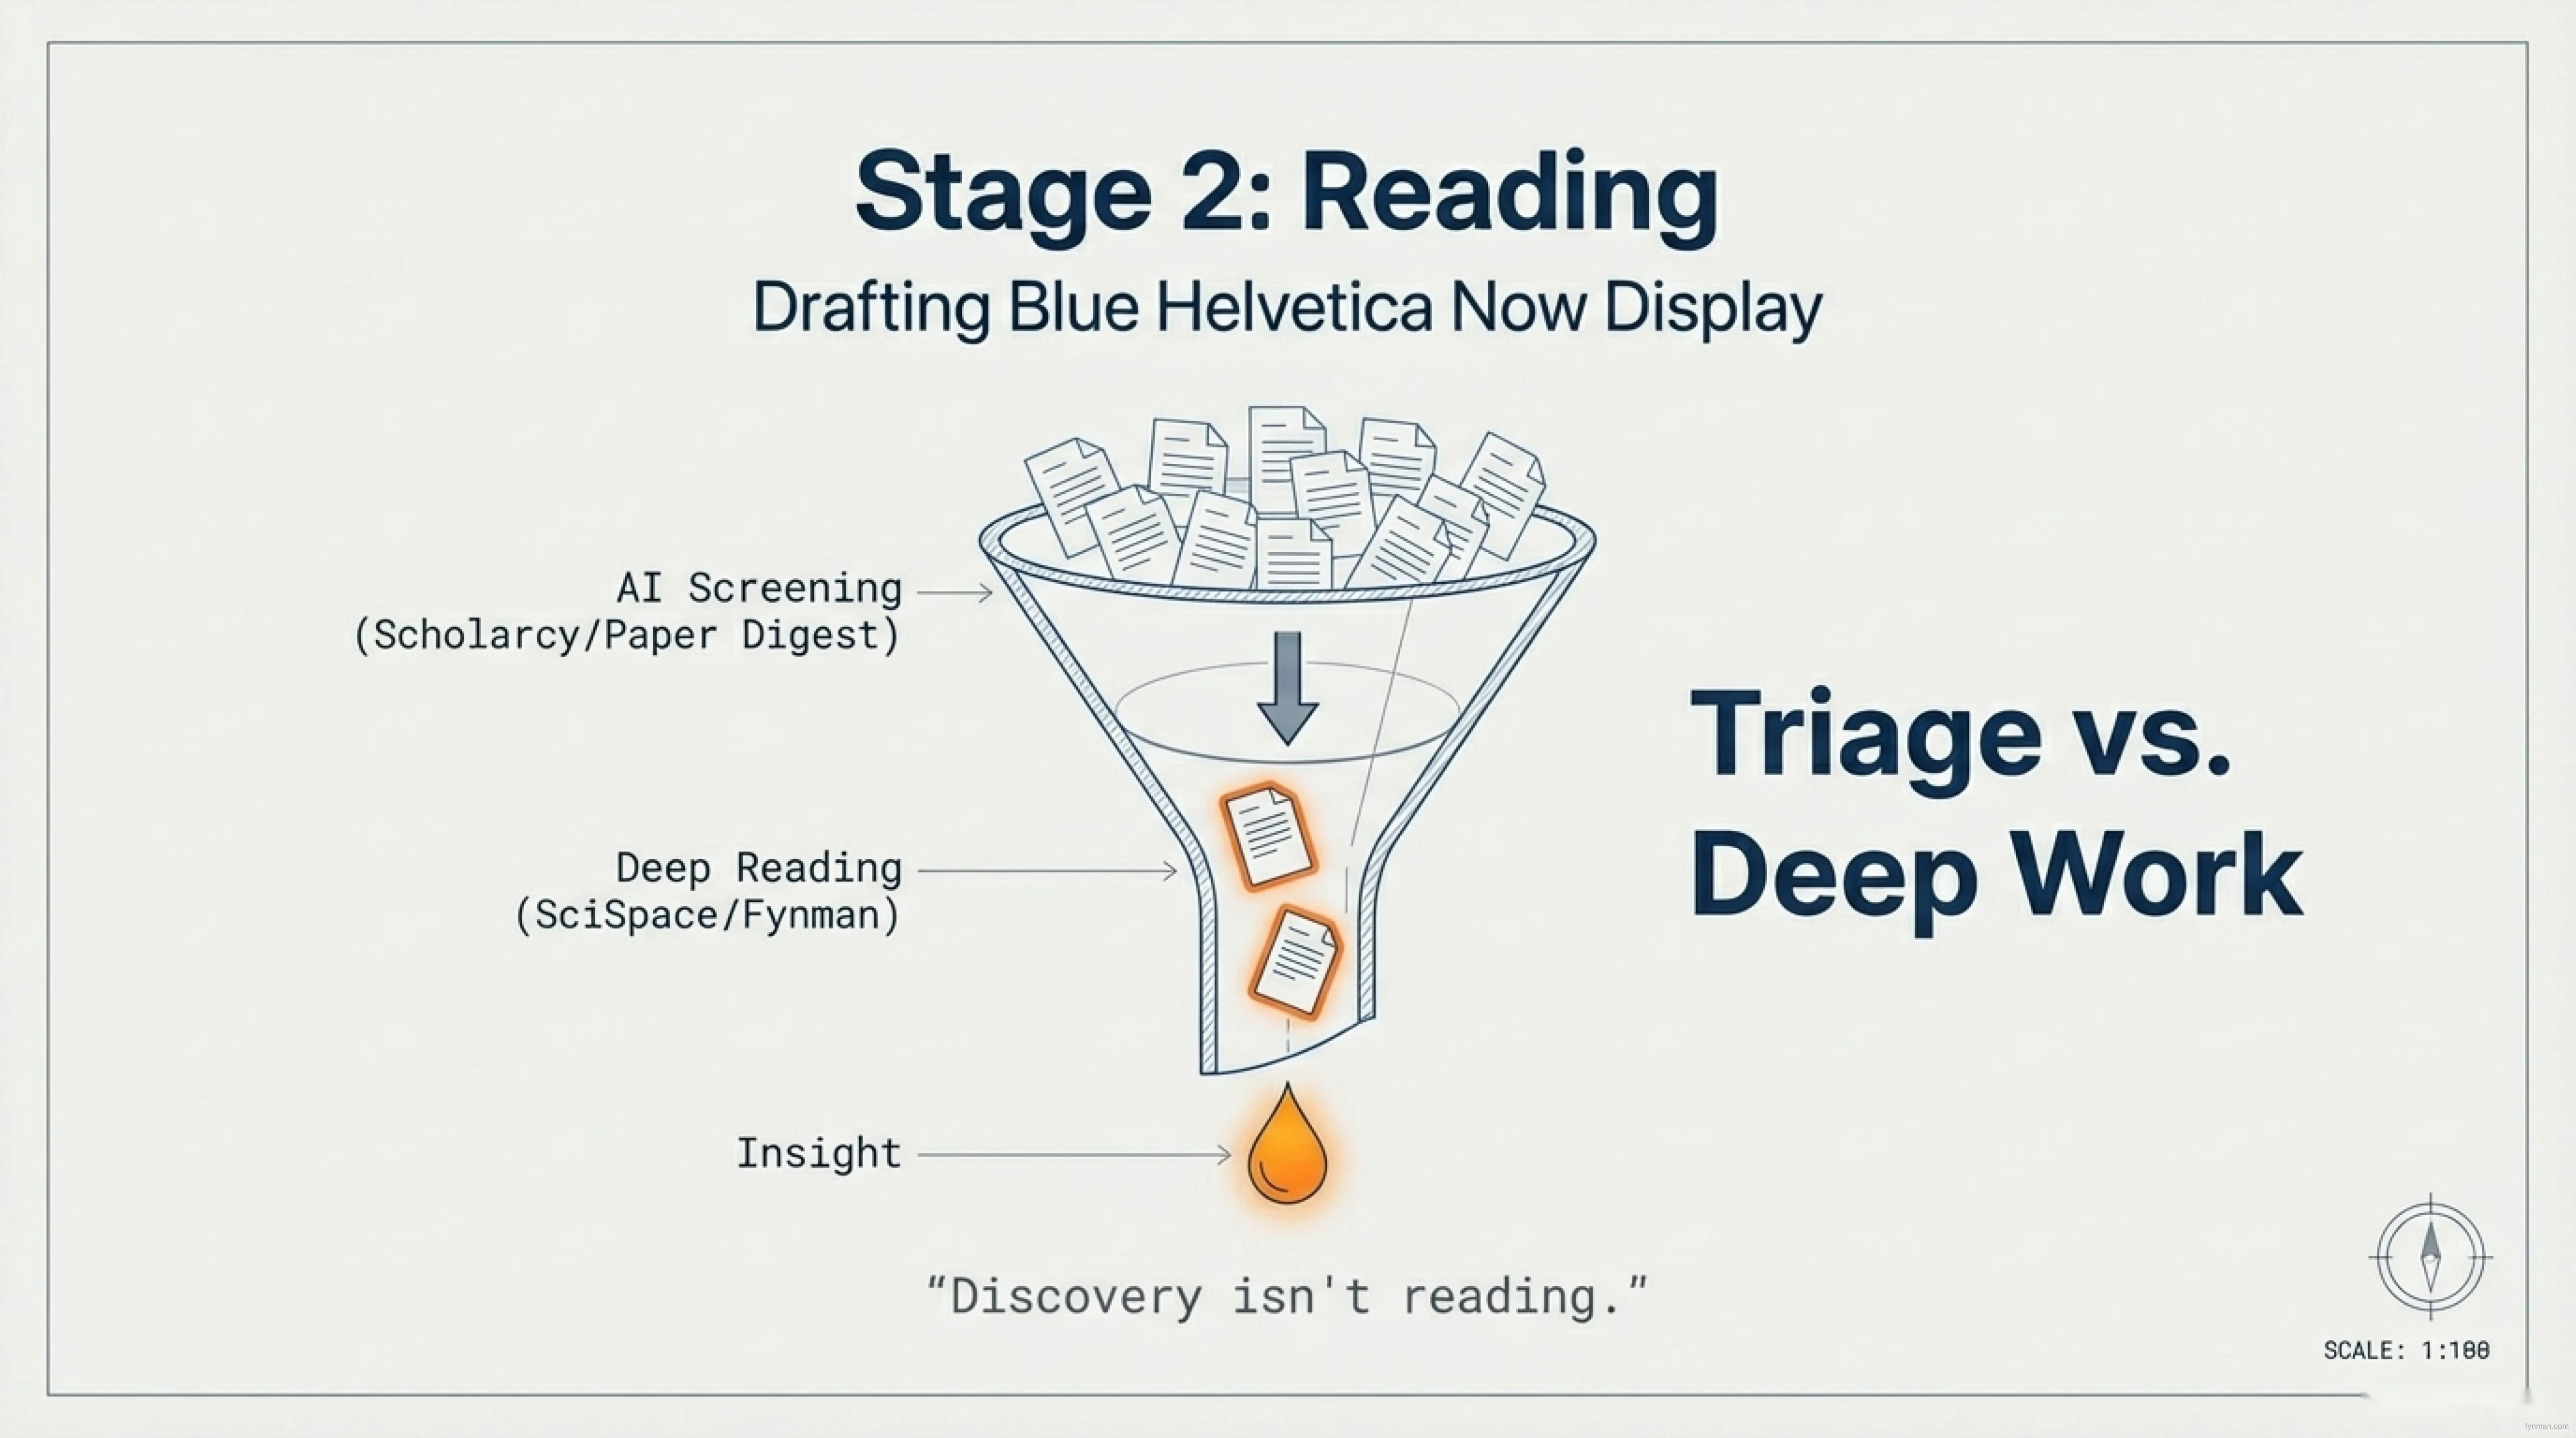
Not all papers deserve the same attention. Some are foundational and need deep engagement. Others provide context and a skim is enough. Others are tangentially related and warrant only a note. Don’t apply deep reading to all papers equally.
This is where AI screening tools excel. They summarize papers and tell you whether they’re relevant to your specific research question. Use AI for triage—fast, initial filtering. But understand the limitation: AI is excellent at identifying which papers are potentially relevant, but it cannot extract the nuanced insight that comes from careful human reading.
The disciplined approach: Use tools like Scholarcy or Fynman to quickly summarize 50 papers and flag which 10-15 are worth your careful attention. Then carefully read those 10-15. Take real notes. Engage with the arguments. Question the methodology. This is where your original thinking happens. Most researchers skip the triage phase and deep-read everything, which is why they’re always behind. Others over-rely on AI summaries and miss the serendipity and creative insight that comes from close reading.
The balance matters: AI handles breadth (finding signal in noise), but humans handle depth (extracting meaning from signal). Tools like Fynman (which integrate discovery, AI triage, and deep reading into one workspace) eliminate context switching between these phases—you move naturally from “is this relevant?” to “what does this mean?”
Here’s a key insight: Discovery isn’t reading. Triage isn’t deep work. Finding 1,000 papers means nothing if you deep-read only 5. The goal is finding the right papers first (discovery), identifying which matter most (triage), then reading those deeply (work).
Stage 3: Organization — Your Single Source of Truth
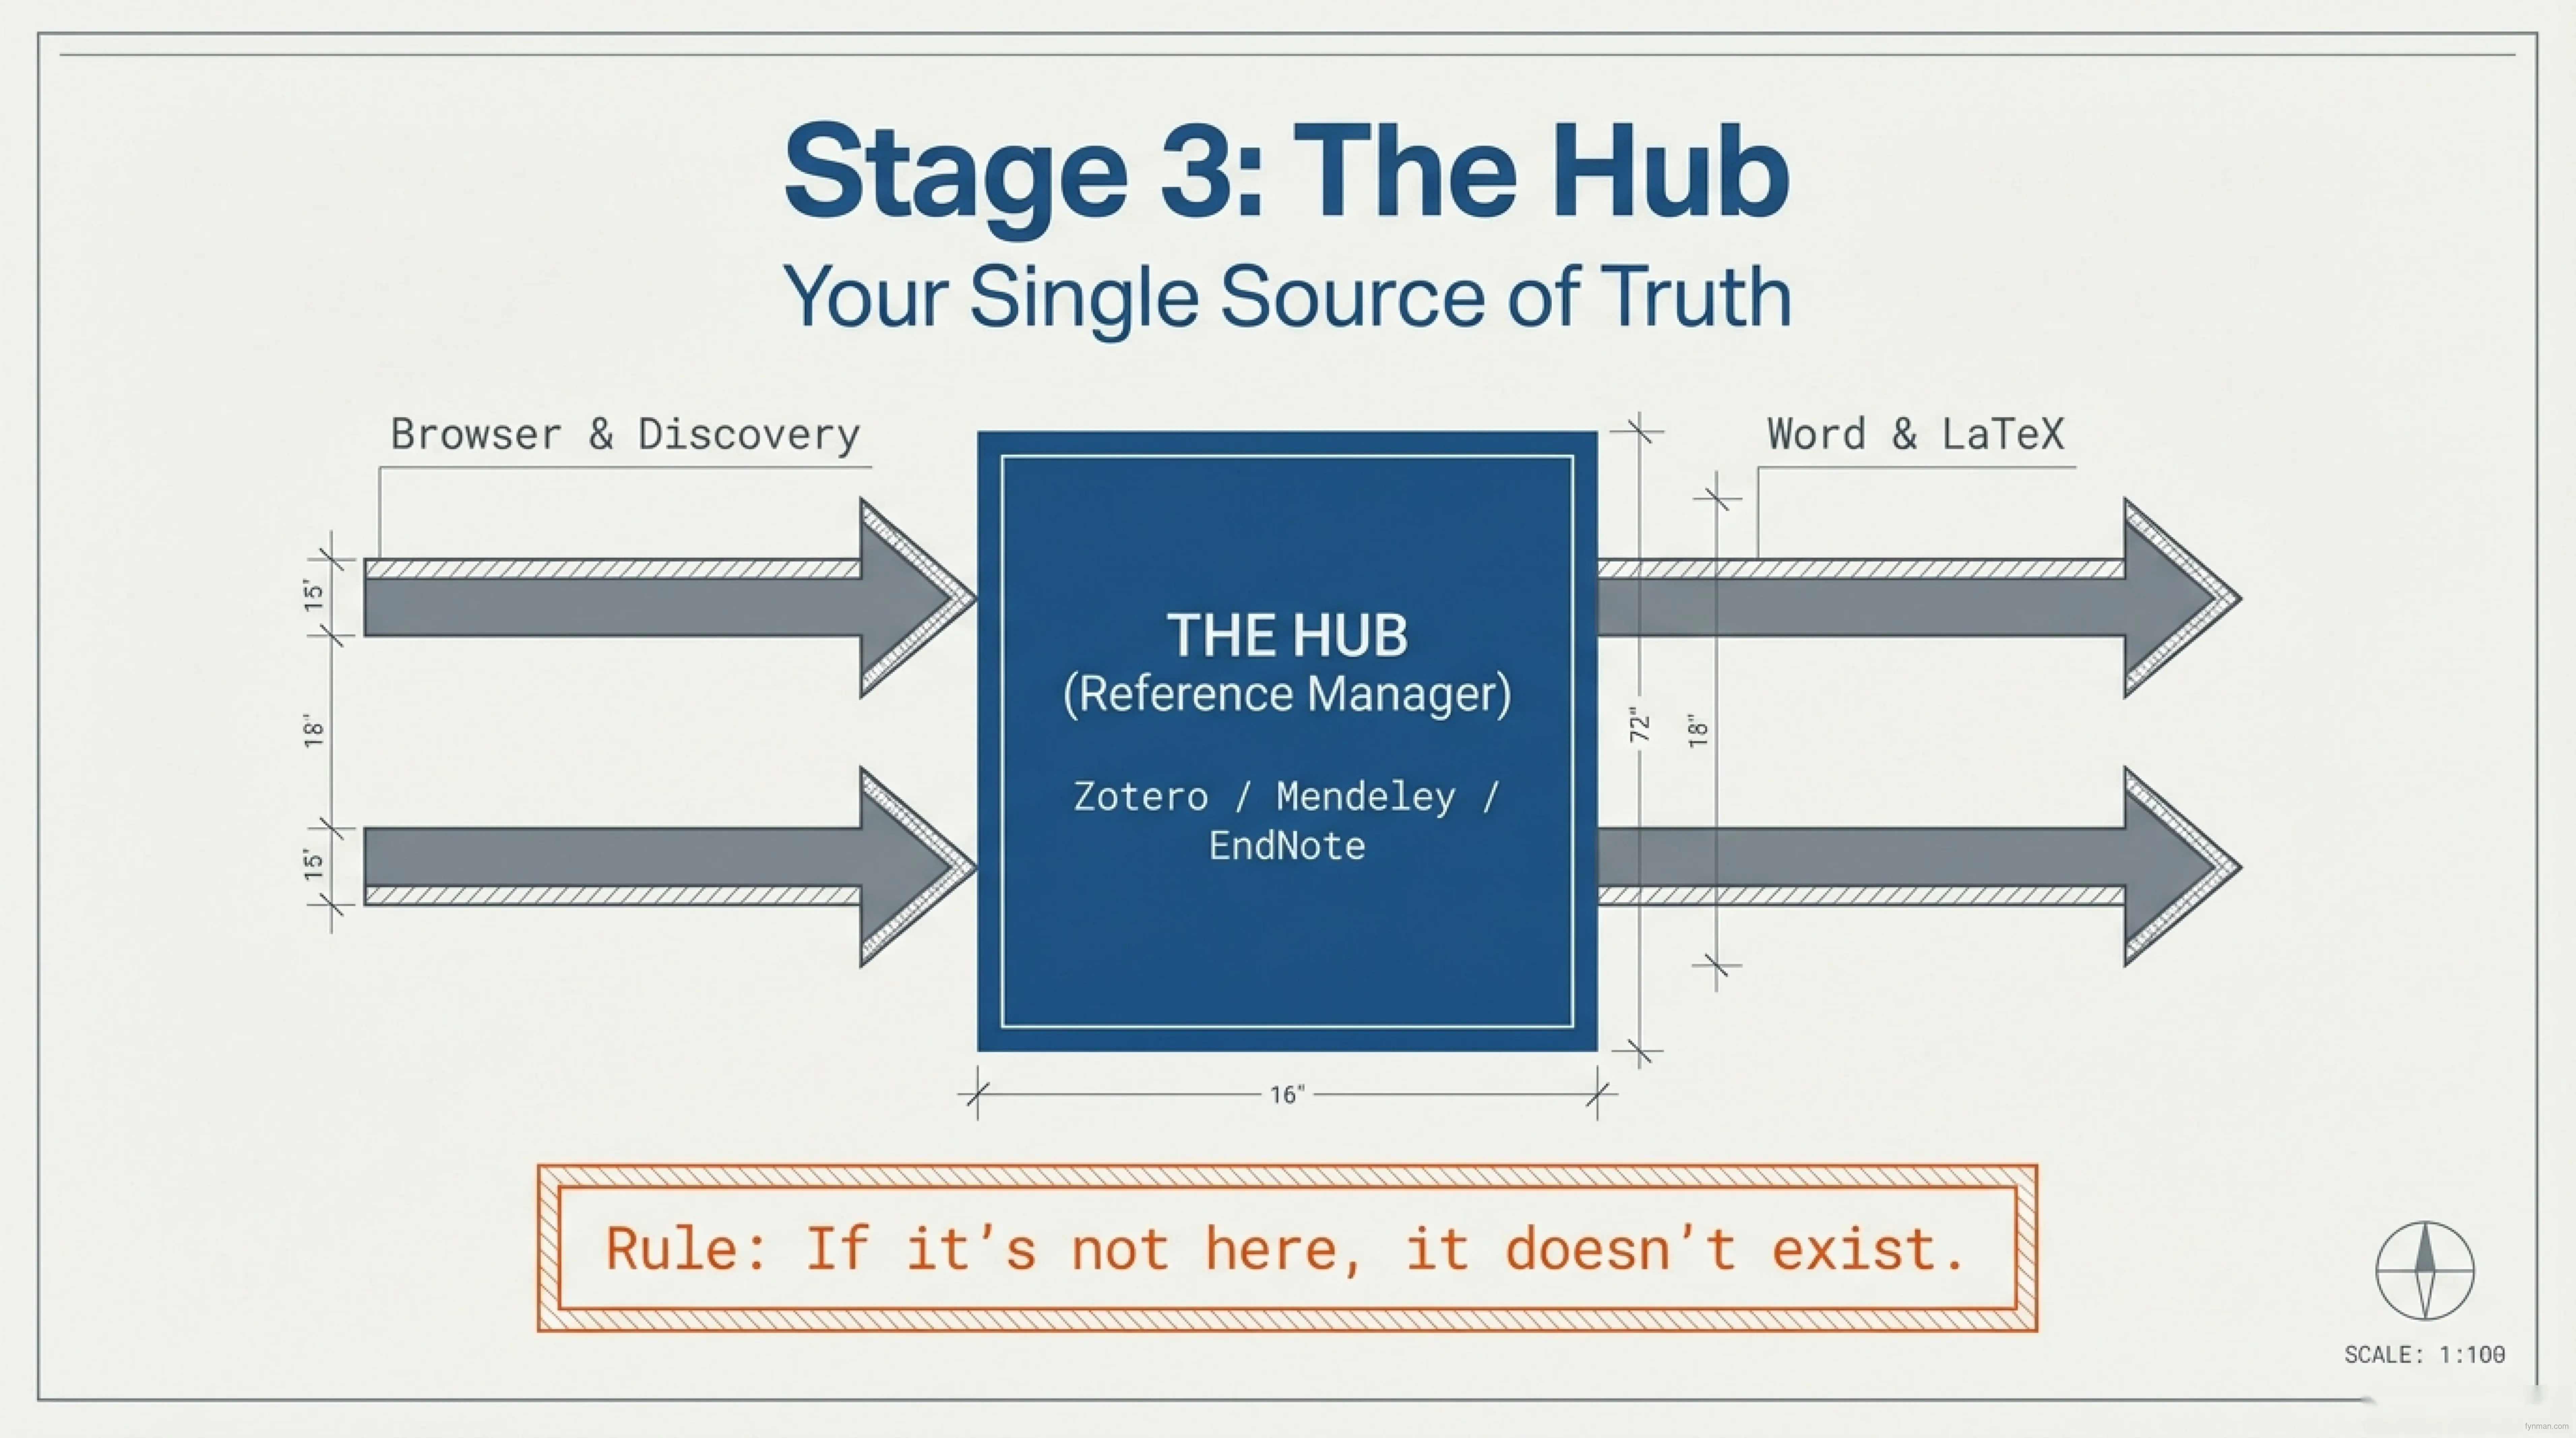
Everything you collect needs to live somewhere. This is your reference hub. It’s also your resilience checkpoint.
The rule: If it’s not in your reference manager, it doesn’t exist. Choose your hub carefully—it will be the single most important tool in your workflow.
Pick one: Zotero (free, open-source, exports to any format), Mendeley (paid, more polished UI), or EndNote (paid, institutional support). Set it up. Add the browser extension. Every paper you find gets saved here with metadata. This is non-negotiable.
From this point forward, every other tool in your pipeline connects to this hub. It’s the central nervous system of your research system. This is also why your hub must be resilient: it must export to standard formats (BibTeX, CSV, RIS). If your hub tool dies or gets acquired, you can leave with your data intact.
Why Zotero wins on resilience: It’s open-source, exports to every standard format, works offline, and your data belongs to you. If Zotero disappears tomorrow, you can migrate to something else in an afternoon. With proprietary tools, you’re vulnerable to vendor lock-in.
The structure: Create 3 folders: Current Projects, By Topic, Archive. That’s it. Don’t over-organize. Simplicity is resilience.
The handoff: Your reference manager exports to Word, LaTeX, and writing tools. Your notes app can pull metadata from it. This connection is the foundation of your entire system.
Stage 4: Note-Taking — Don’t Let Insights Die in PDFs
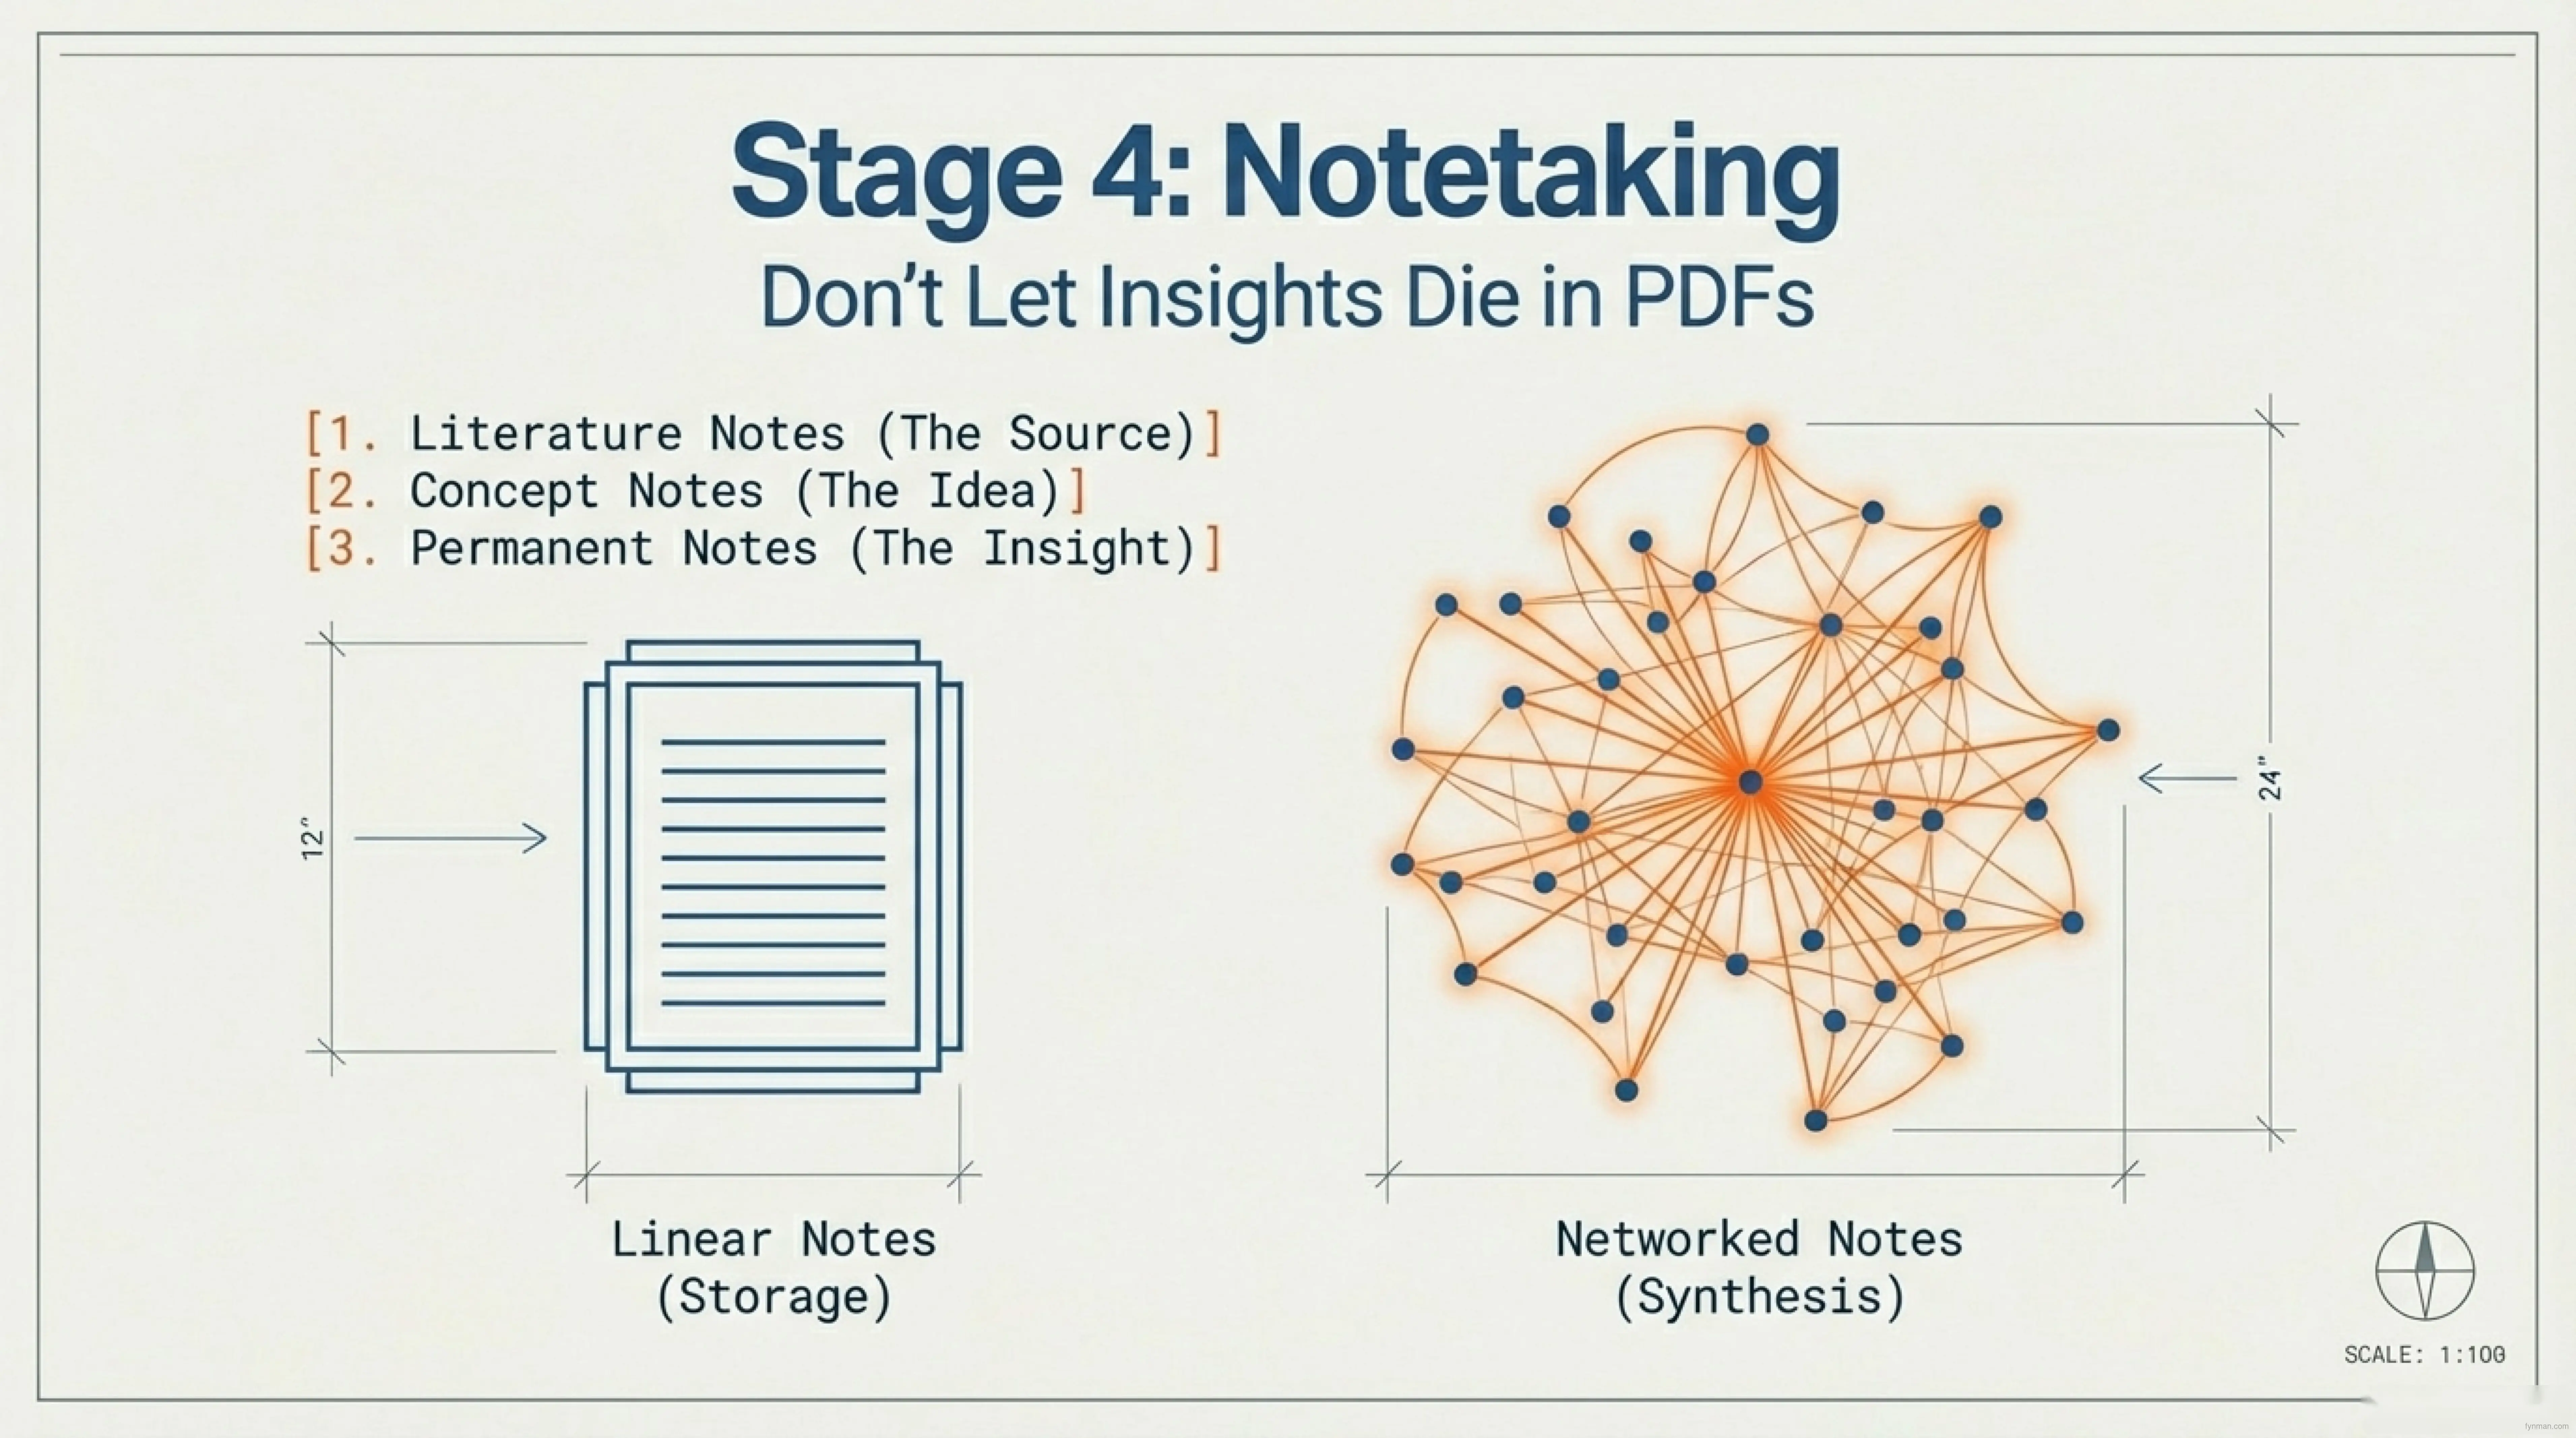
This is where most researchers fail. They annotate PDFs, highlight passages, write marginal notes—and never look at them again. Insights trapped in PDF margins are dead insights. You spent hours reading and thinking, and the output is scattered across 50 PDFs you’ll never re-open.
The fix is moving from linear notes to networked notes. Linear notes (a transcript of what you read) are useful for recall in the moment but useless six months later. Networked notes create a system where ideas connect. This is where your best thinking lives because you’re forced to articulate how concepts relate to each other.
The practice that makes this work is the three-level note system. First, capture literature notes—direct excerpts and summaries from papers. These are storage, not thinking. Second, write concept notes—your interpretation and how this idea relates to other concepts you’ve encountered. This is where thinking happens. Third, distill everything into permanent notes—standalone ideas written as if you’re explaining them to someone else. These become your foundation for writing.
This takes discipline. This is also where human creativity lives. When you manually synthesize ideas from multiple papers, you sometimes find unexpected connections. An AI summary might tell you what a paper says. But when you connect it to something you read three weeks ago, you find an original insight. That serendipity—the creative leap—is where your research becomes original.
Don’t over-automate this stage. Yes, AI can help with initial triage and summarization. But the synthesis, the thinking, the making-of-connections must be human work. Your permanent notes become your first draft because they’re already synthesized thinking, not scattered annotations. The best research workspaces (like Fynman) integrate reading, synthesis, and note-taking into one space where you’re doing the hard thinking work, supported (not replaced) by AI.
The right tool depends on your discipline. STEM researchers should use R or Python notebooks (live computation plus notes live together). Social scientists can use NVivo for qualitative coding or Obsidian for linked synthesis notes. Humanities scholars benefit from Obsidian’s networked notes or Scrivener’s narrative flow.
The handoff: Level 3 permanent notes feed directly into your writing stage.
Stage 5: Writing — Match the Tool to Your Field
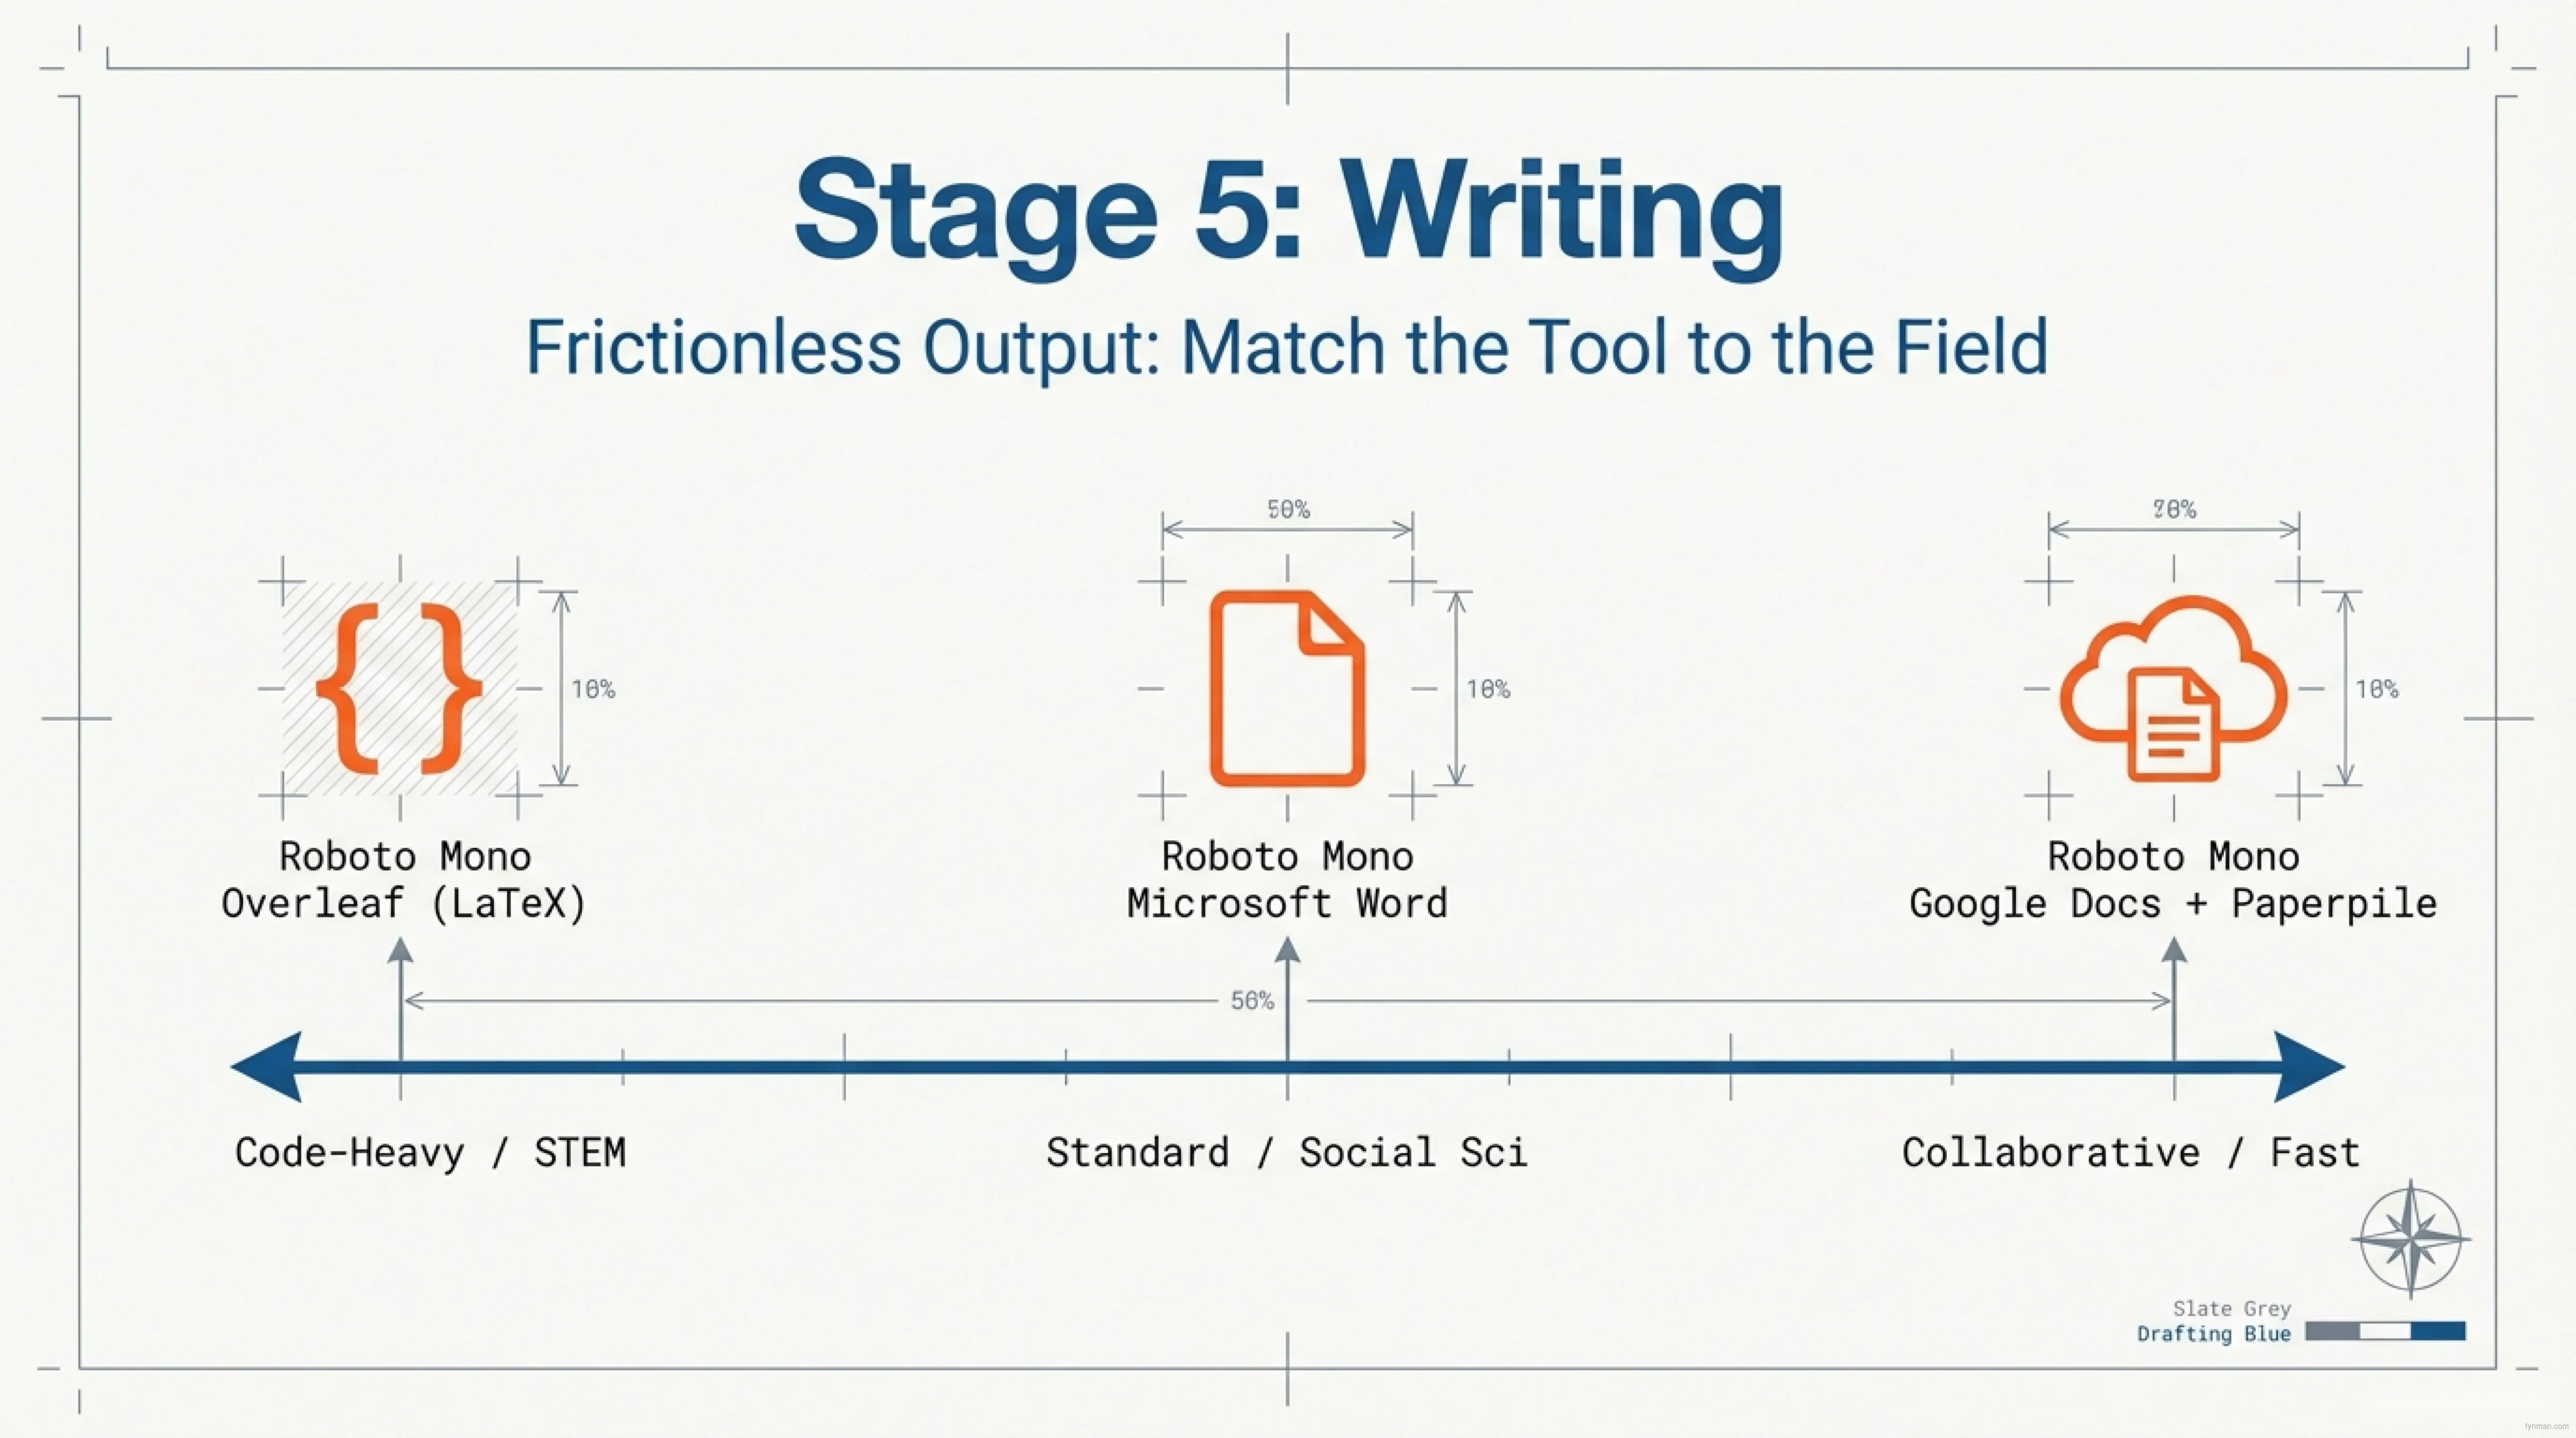
Different disciplines have different needs. STEM researchers working with complex equations and reproducible code need LaTeX in Overleaf—it’s painful to learn, but your field expects perfect typesetting and you need to embed code. Social scientists usually work in Microsoft Word because it’s ubiquitous, your advisor uses it, journals accept it, and reference manager integration is seamless. Researchers in collaborative environments (some humanities, some social sciences) benefit from Google Docs plus Paperpile for real-time collaboration and shared comments.
The principle here matters more than the specific tool: Minimize tool friction at the stage where you’re most creative. Writing is where you do your best thinking. Don’t waste mental energy fighting the tool. The handoff from your reference manager should be invisible—you insert citations by typing the author name, not copy-pasting entries or manually formatting citations.
Stage 6: Analysis — The Fork in the Road
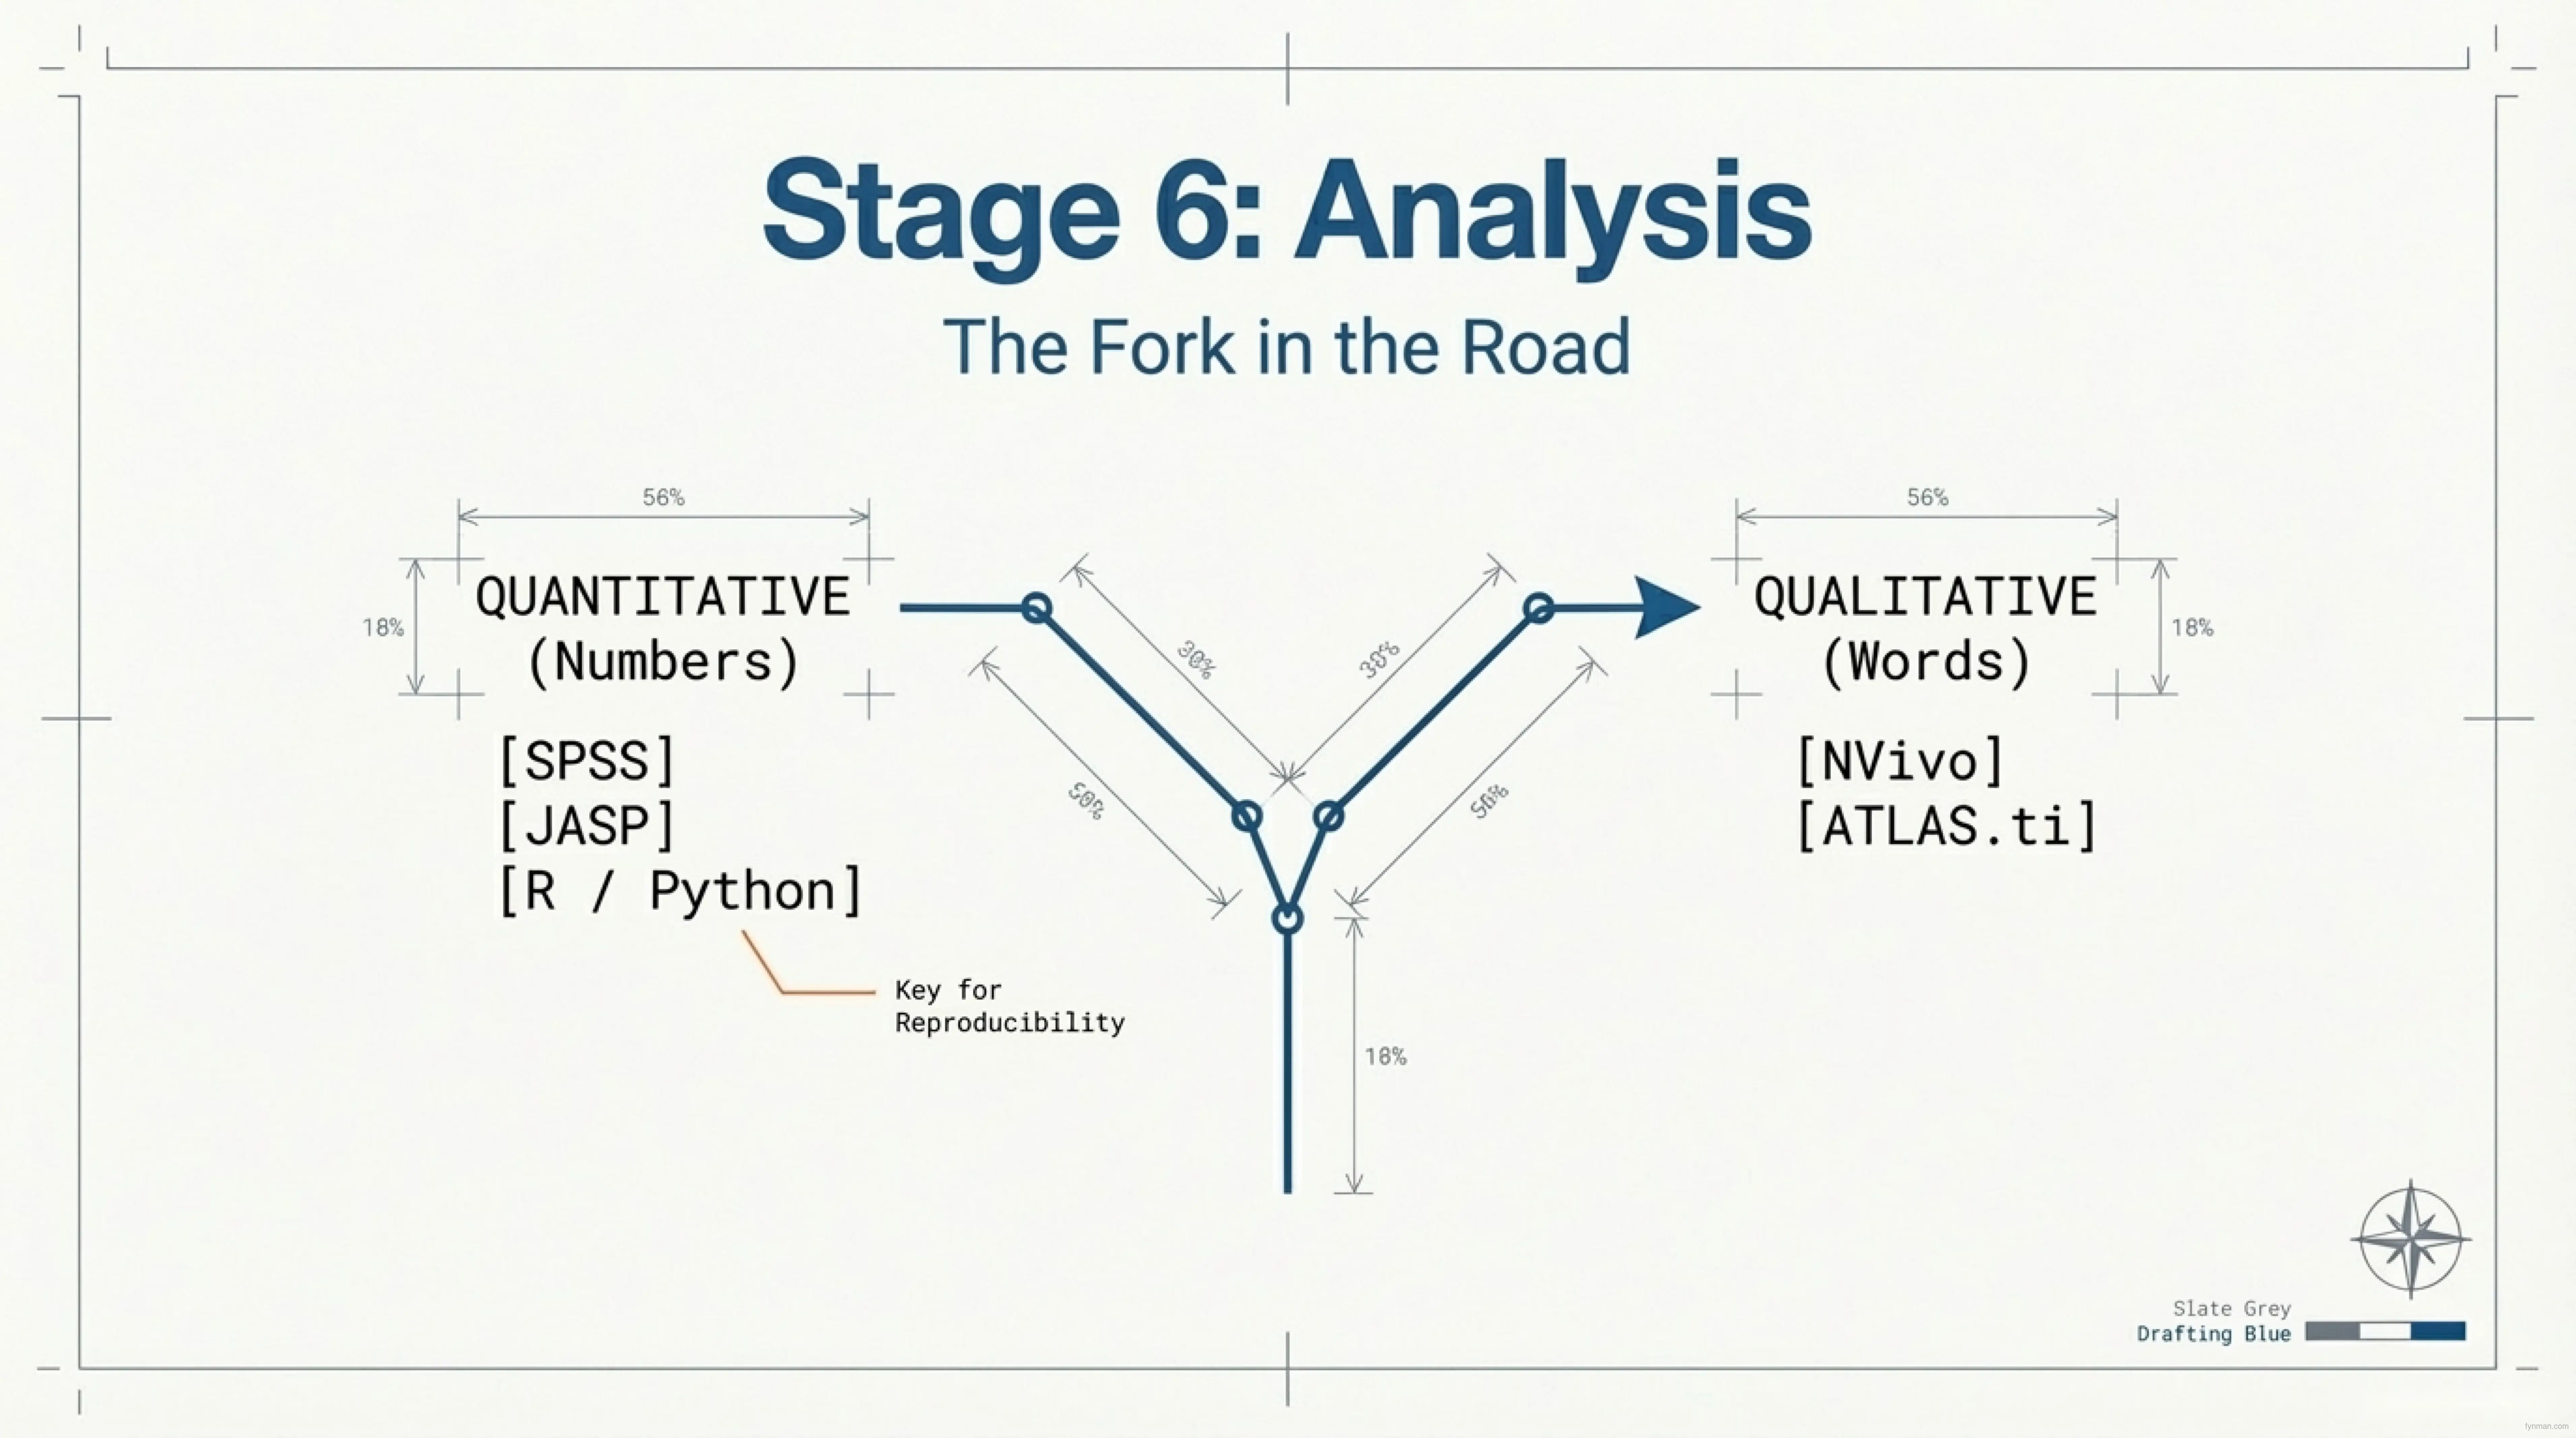
This is where quantitative and qualitative research paths diverge. Both are equally valid. Both demand the same principle: reproducibility.
Quantitative path: Use SPSS, R, or Python. The key word is reproducibility. Your analysis must be transparent enough that someone else can run your code and get identical results. R and Python win here because you write scripts that document every step. SPSS encourages point-and-click workflows that are hard to replicate. Write reproducible scripts. Version control them. Someone reading your thesis should be able to regenerate every table and figure from your raw data and your code.
Qualitative path: Use NVivo, Atlas.ti, or MAXQDA for coding and theme synthesis. Your coding decisions must be transparent—another researcher should understand why you coded a passage one way and not another. Document your codebook. explain your logic. Show your work.
The split is roughly 50/50 across disciplines. Choose the one that fits your research questions. In either case, your analysis produces outputs that flow to your final stage—tables, figures, statistical summaries, or thematic maps. The crucial part: someone else must be able to understand how you got there. Analysis without reproducibility is just opinion.
Stage 7: Presentation — From Data to Story
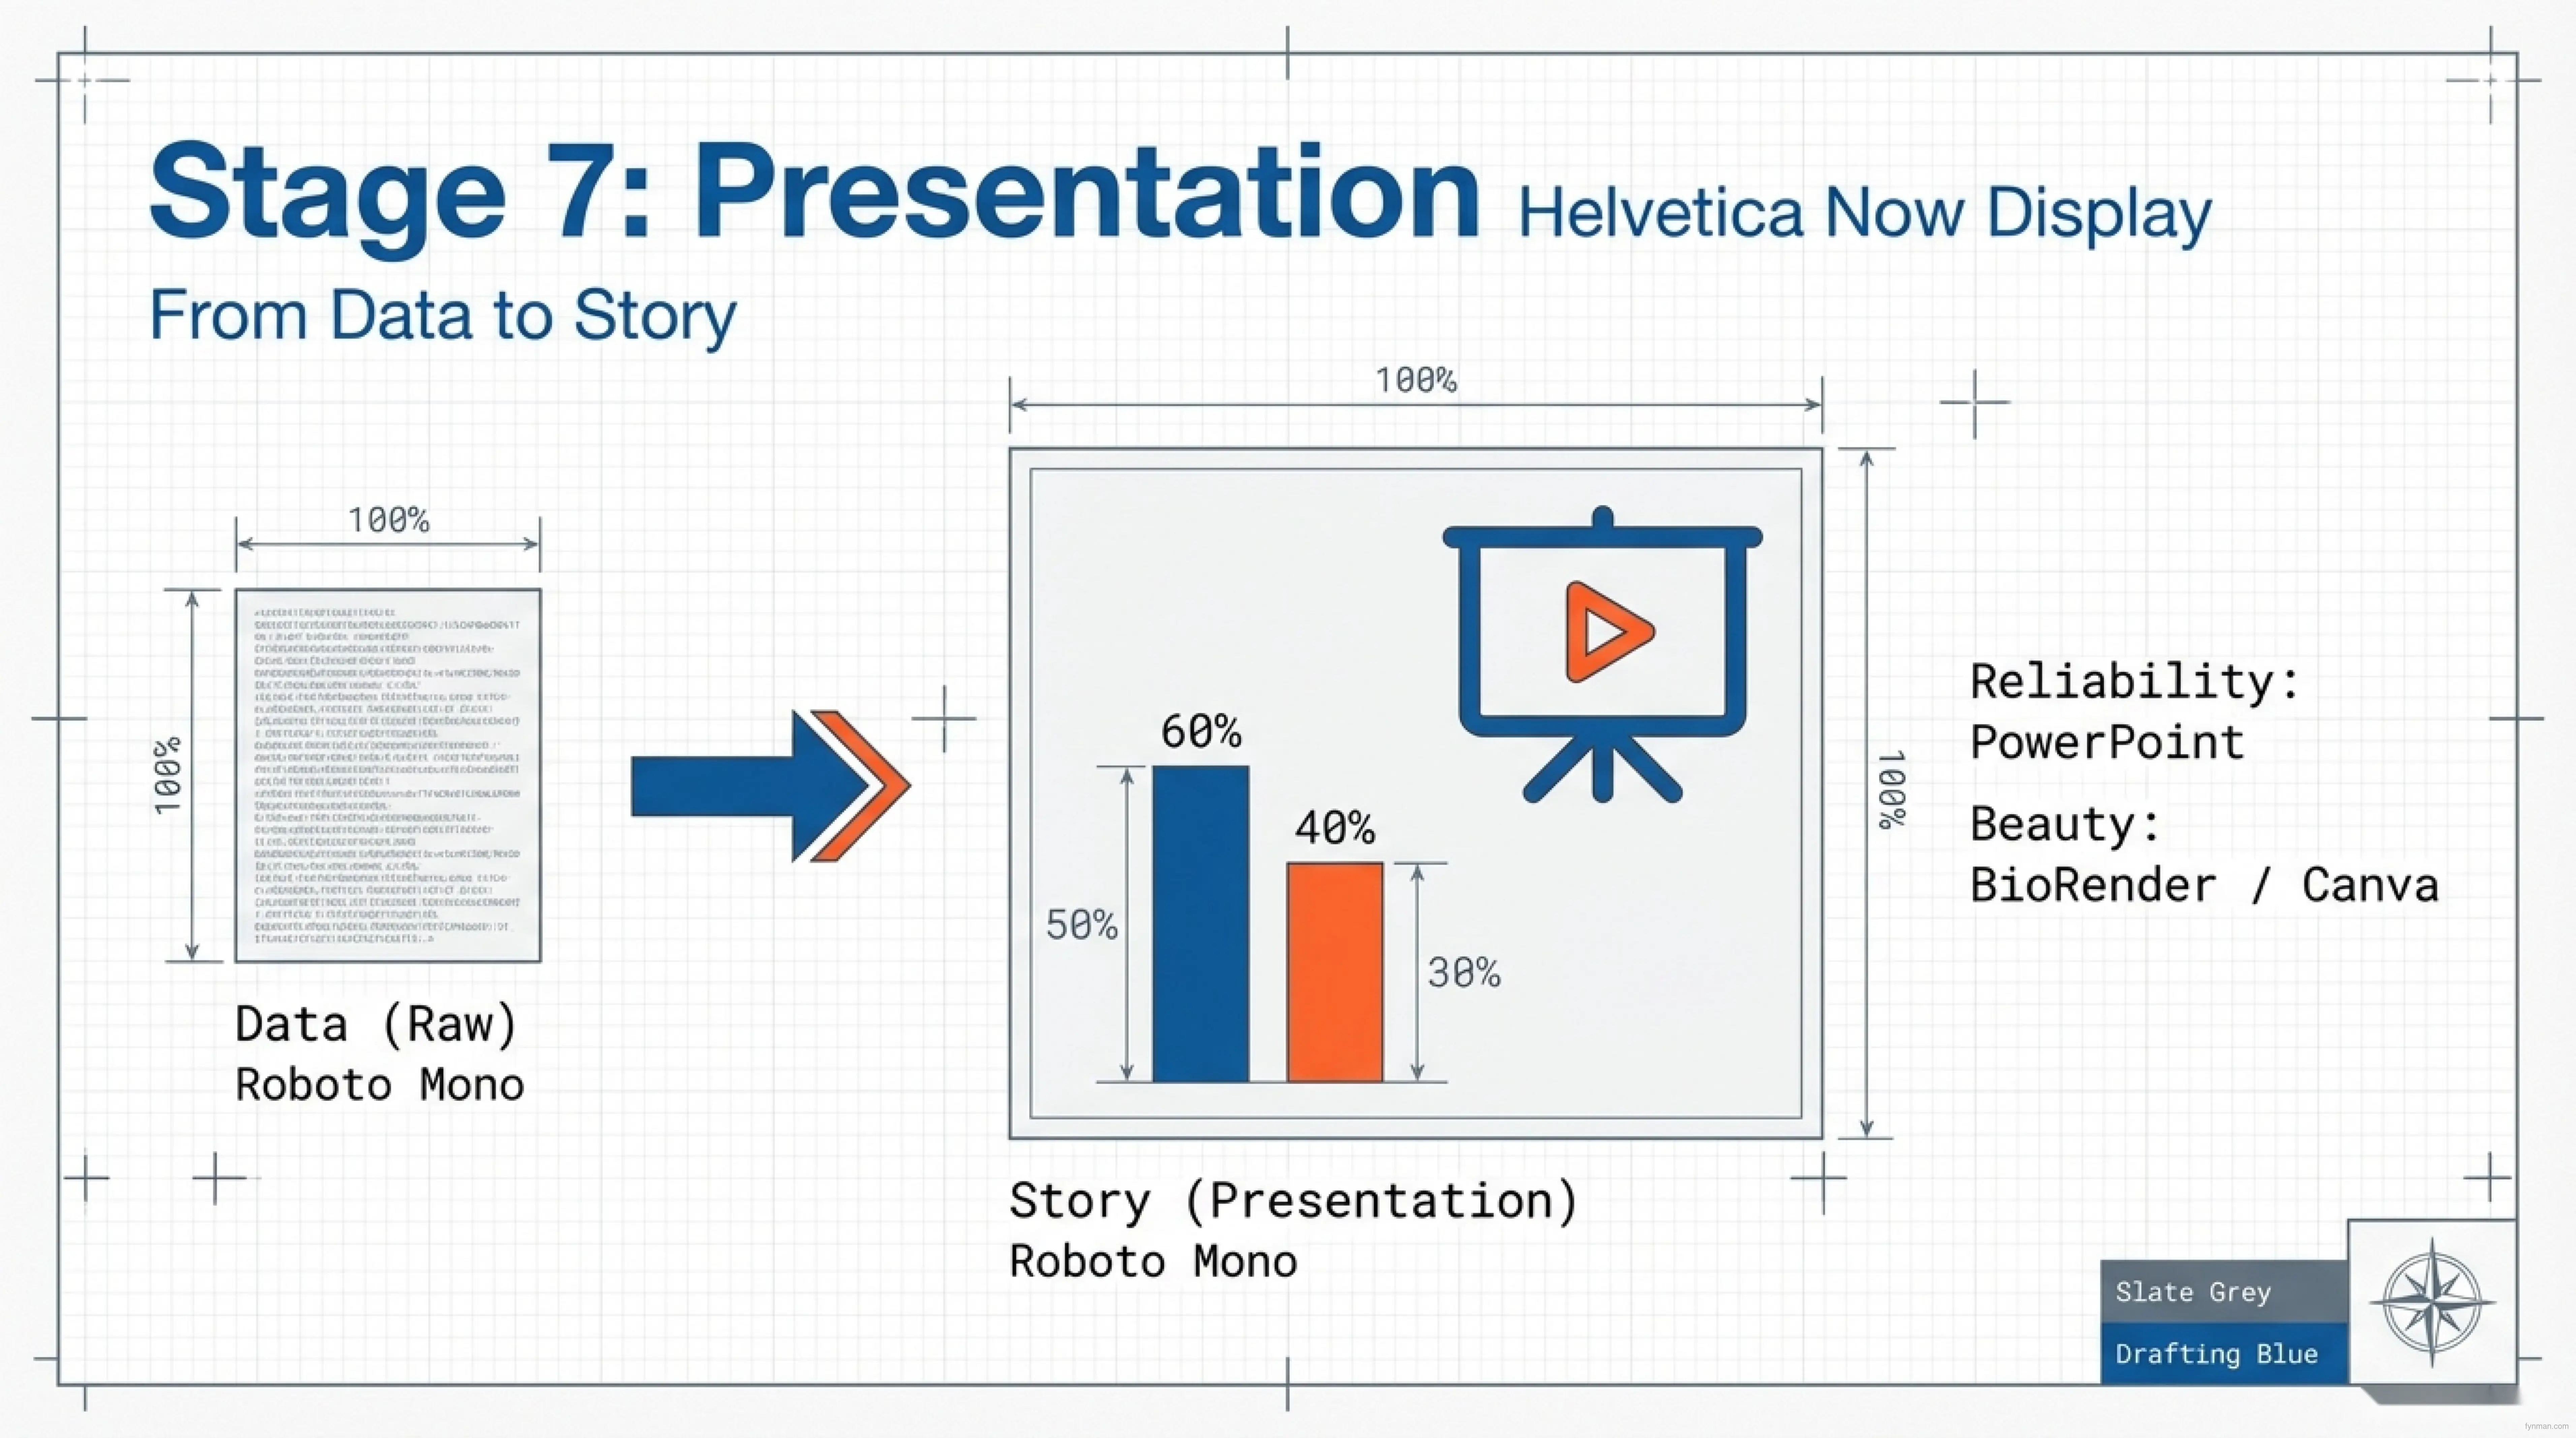
Raw data is boring. A bar chart is better. A story with context is best.
This is where you transform what you’ve learned into something others can understand. It’s the last stage, but it’s not an afterthought.
For presentations: PowerPoint is reliable, but it’s boring. Canva is beautiful. BioRender (for life sciences) is specialized.
For papers: Tables and figures that tell a story. Each visual should answer one question.
The principle: Don’t lose impact at the last stage. You did the research. You found insights. Now present them clearly.
The feedback loop: Your presentation raises questions. Those questions become the discovery phase of your next research cycle. The loop closes and repeats.
The Minimal Viable Stack: 4 Tools That Actually Connect
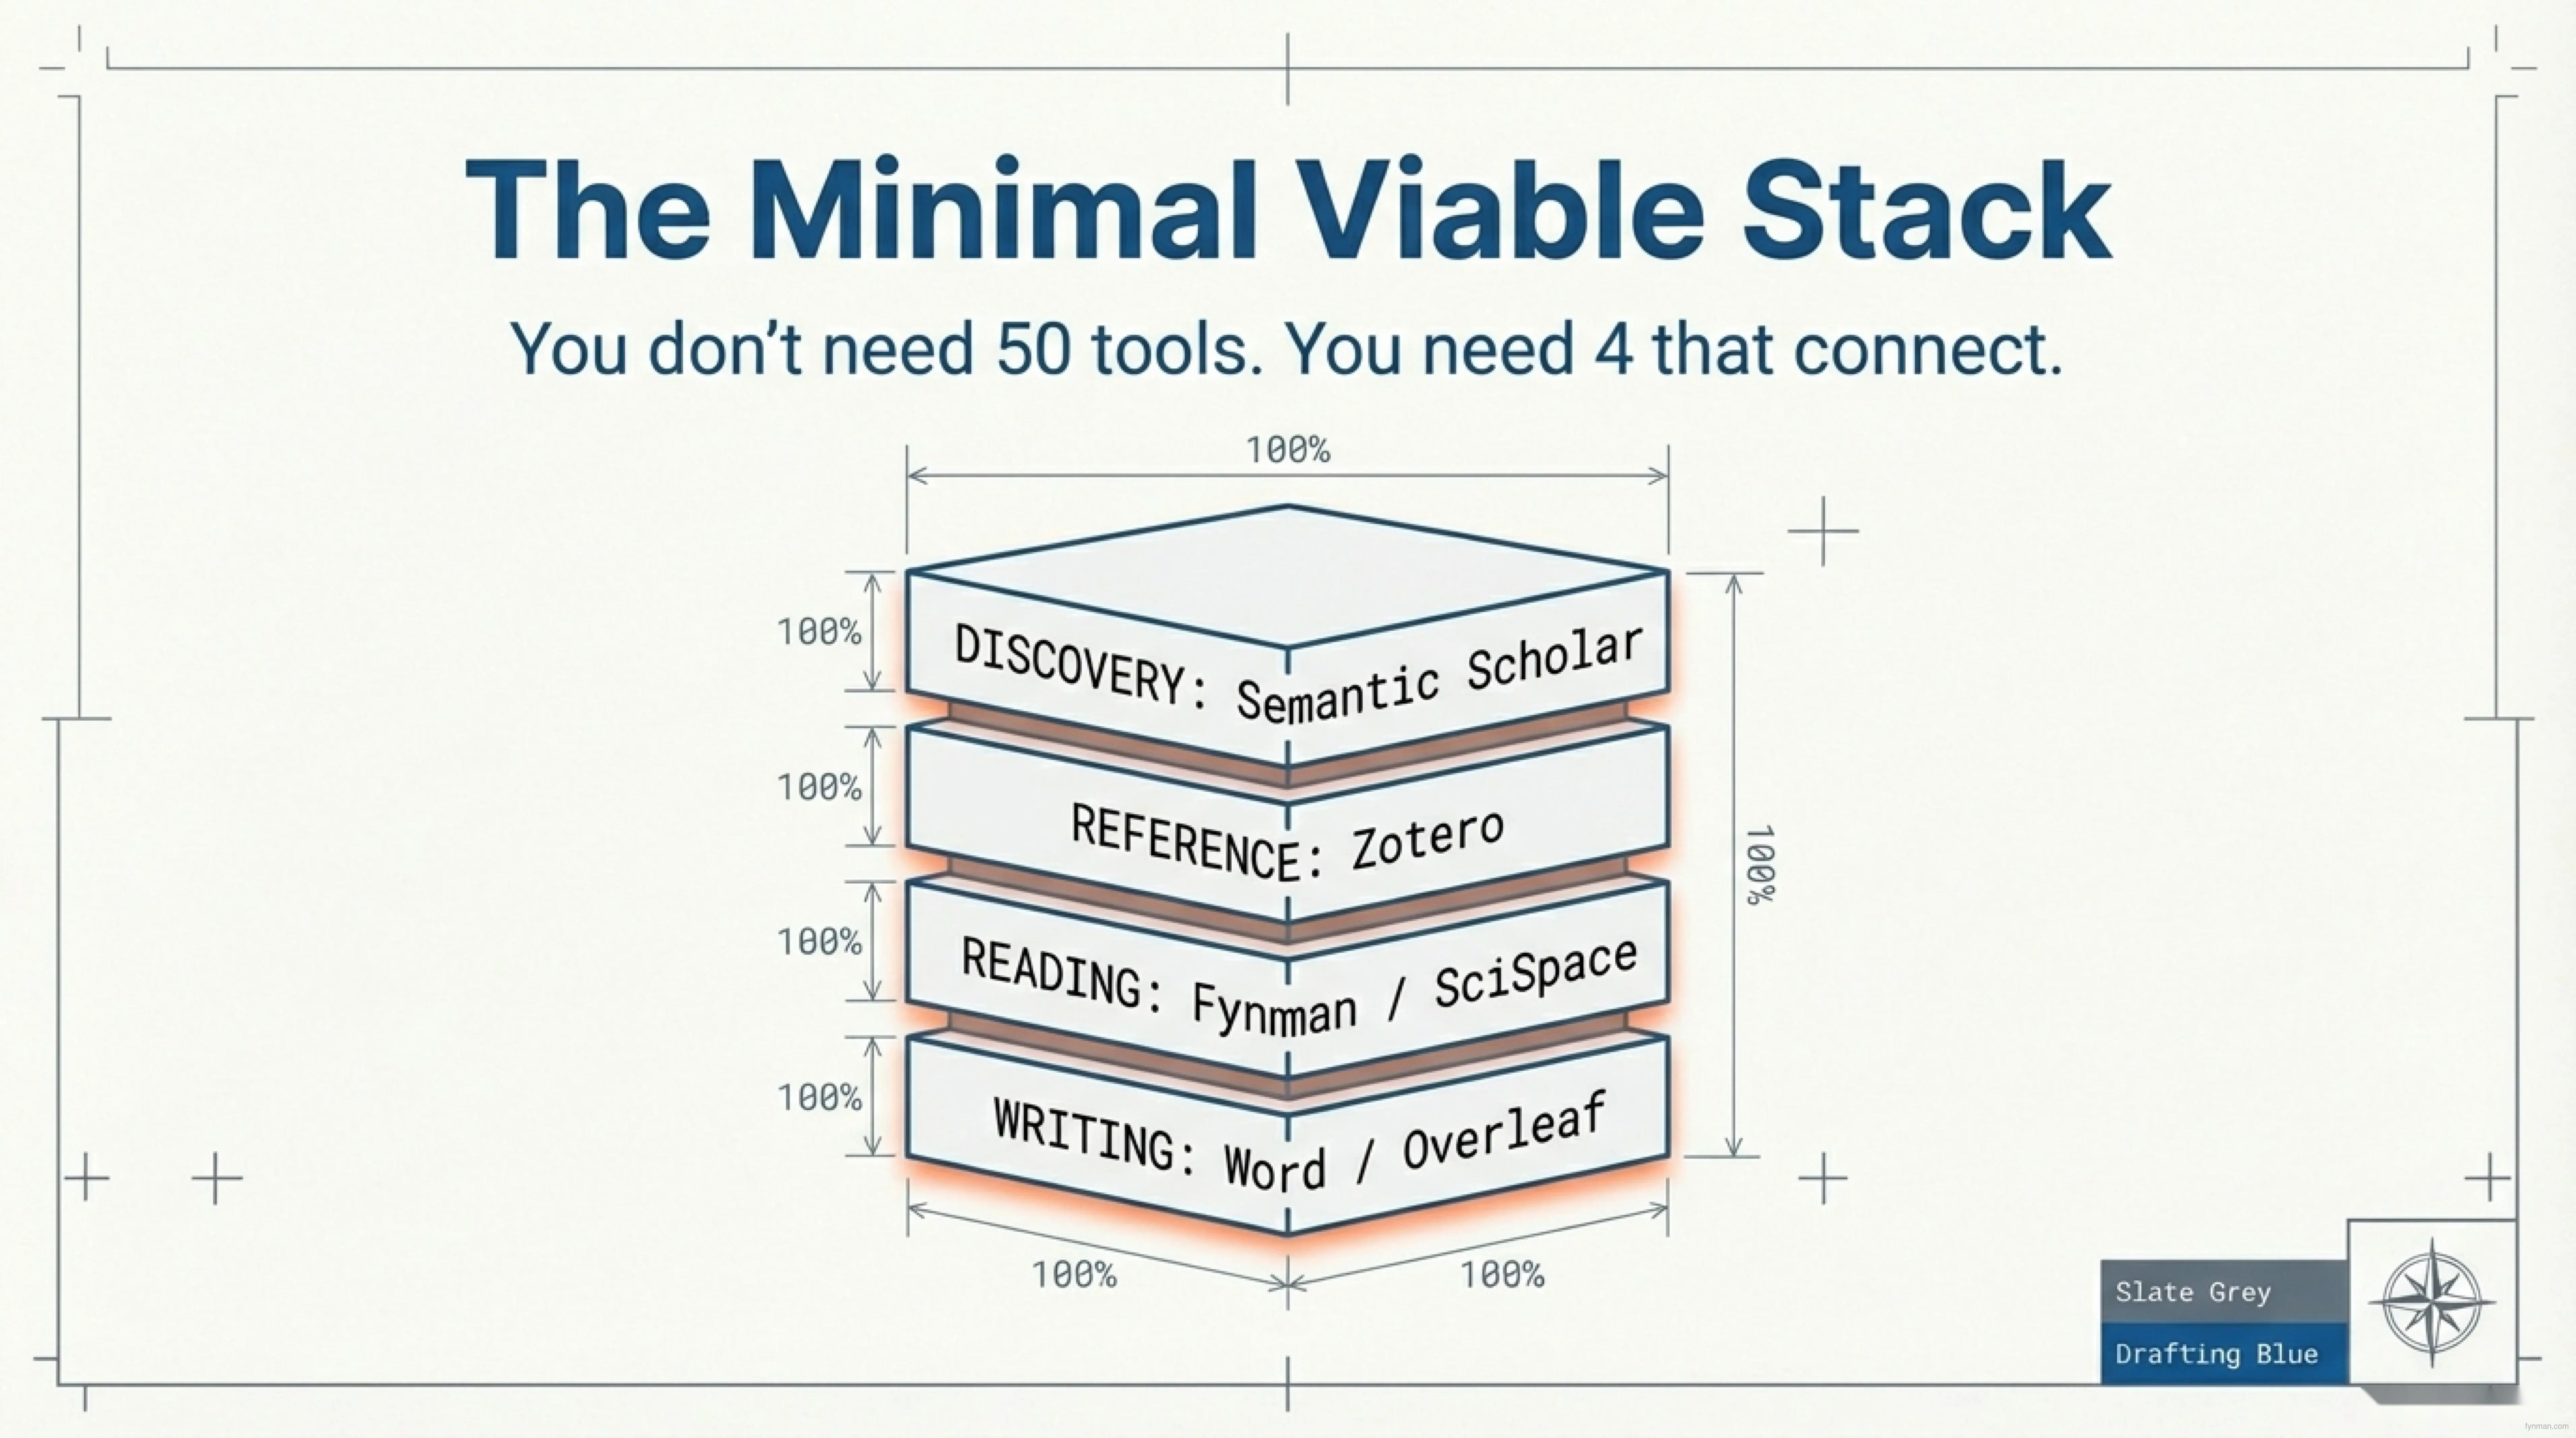
You don’t need 50 tools. You need 4 that talk to each other.
Here’s the baseline setup:
| Layer | Purpose | Tool |
|---|---|---|
| Discovery | Find papers in your field | Semantic Scholar or PubMed |
| Reference (Hub) | Store all papers with metadata | Zotero or Mendeley |
| Reading | Deep reading + synthesis notes | Fynman or SciSpace |
| Writing | Compose and cite | Word or Overleaf |
That’s it. Everything else is optional optimization.
How They Connect
- Discovery → Reference: Export your curated list from Semantic Scholar into Zotero (one click).
- Reference → Reading: Open papers from Zotero in Fynman. Take notes in your note-taking app.
- Reference → Writing: Cite papers from Zotero while writing in Word using the Zotero plugin. Citations format automatically.
- Notes → Writing: Copy synthesized insights from your notes into your draft.
Critical principle: Each handoff must be automatic or near-automatic. If you’re copy-pasting between tools, you’ve broken the pipeline.
Building for Resilience: The Green Flags
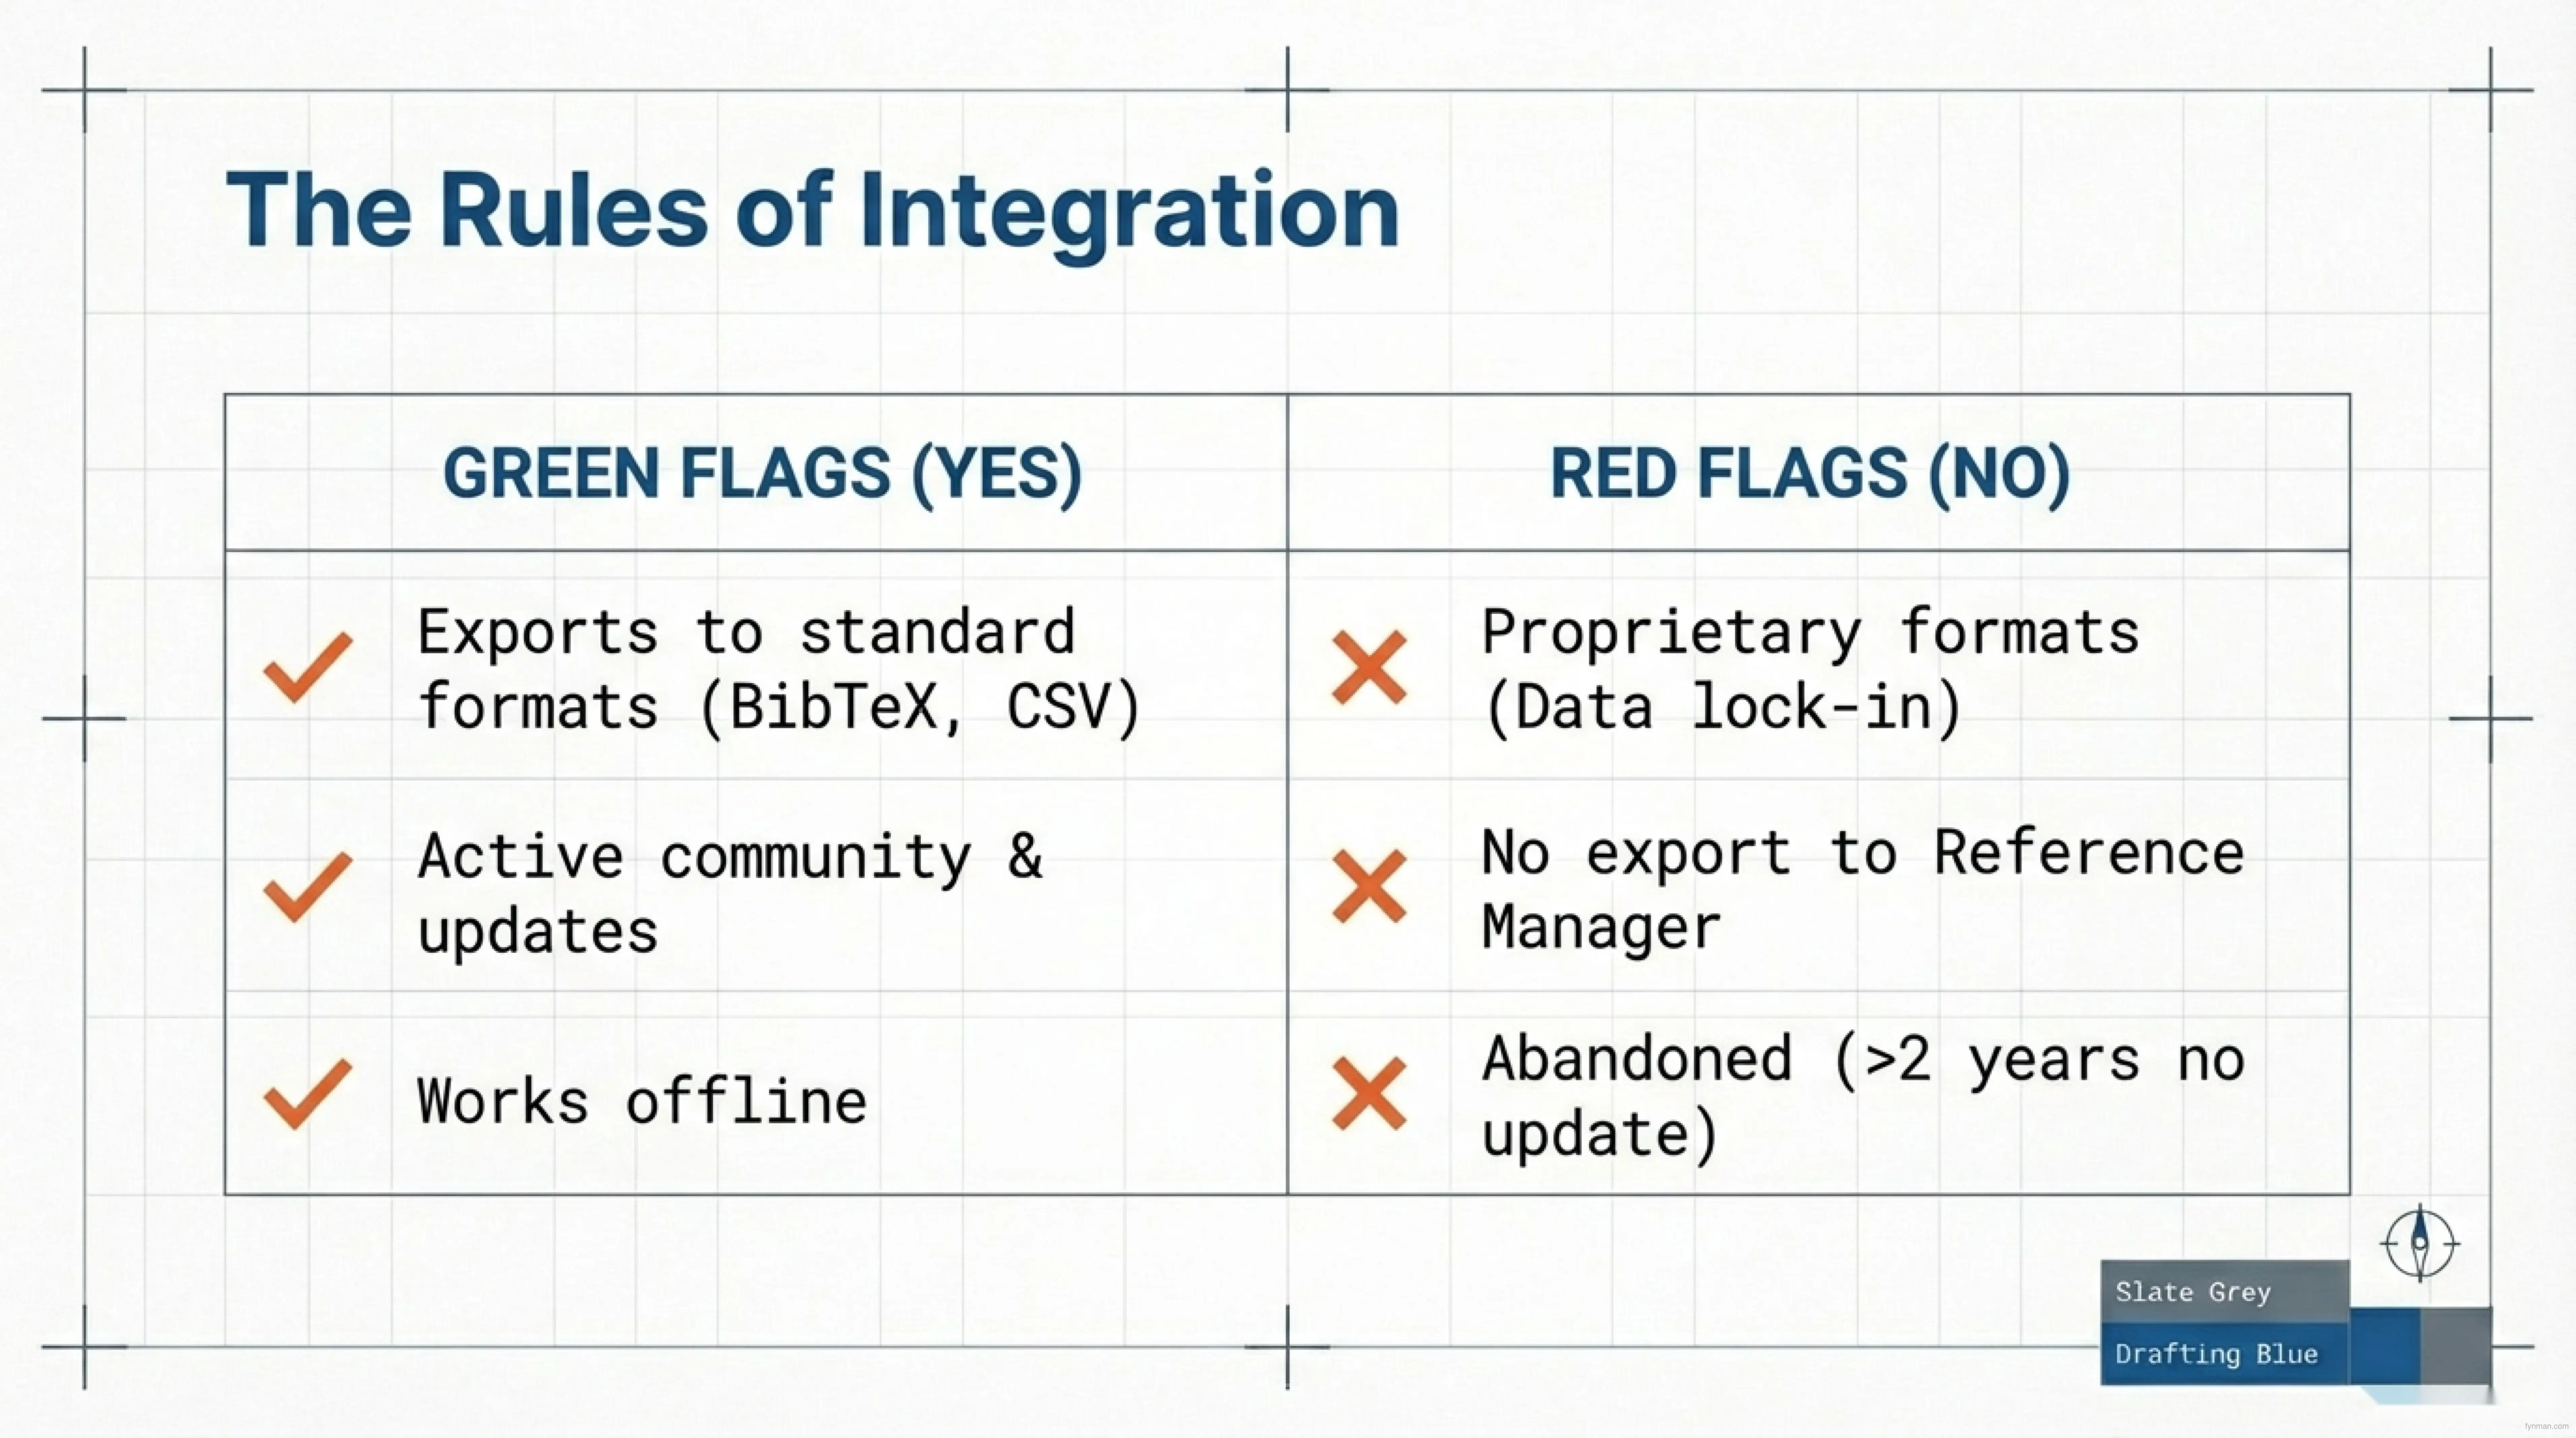
An Architect doesn’t just build for today. They build for resilience—tools that will still work in three years when your research evolves.
Green Flag #1: Exports to standard formats. BibTeX, CSV, RIS, or plain text. If your data can leave the tool easily, you avoid data lock-in. This is what “sovereign research workspace” means—you own your research, not the vendor. If a tool disappears or changes, you can migrate your data in an afternoon.
Green Flag #2: Active community and regular updates. If the developers care about the tool, it won’t disappear in two years. Check when the last update was released. If it’s more than 12 months ago, that’s a warning sign.
Green Flag #3: Works offline. You need to research during flights, conferences, and network outages. Cloud-only tools will fail you.
Green Flag #4: Open ecosystem. Check for API documentation or plugin support. If the tool integrates with others, you can build a system. If it’s walled-off, you’ll be copying and pasting forever.
Red Flags to avoid:
Proprietary formats lock your data inside. No export to your reference manager means the tool is a dead end. Abandoned projects (2+ years without updates) will fail you when bugs appear. Forced cloud-only syncing means you can’t research offline.
Real example: Notion looks beautiful and flexible. But it’s terrible for academic workflows. It doesn’t export to reference managers (dead end). It’s cloud-only with no offline mode (fails when you travel). It forces manual citation input (friction). It has no integration with your central hub. Notion is excellent for organizing thoughts, but it’s not a research system. It’s one isolated piece that doesn’t connect to discovery, reading, or analysis.
By contrast, Zotero checks all the green flags. It exports to every format. It’s actively maintained (community-driven). It works offline. It integrates with Word, LaTeX, Fynman, and dozens of other tools. If you decide to leave Zotero, your entire library exports in 10 minutes. That’s a resilient system.
Discipline-Specific Playbooks: Build Your Stack Now
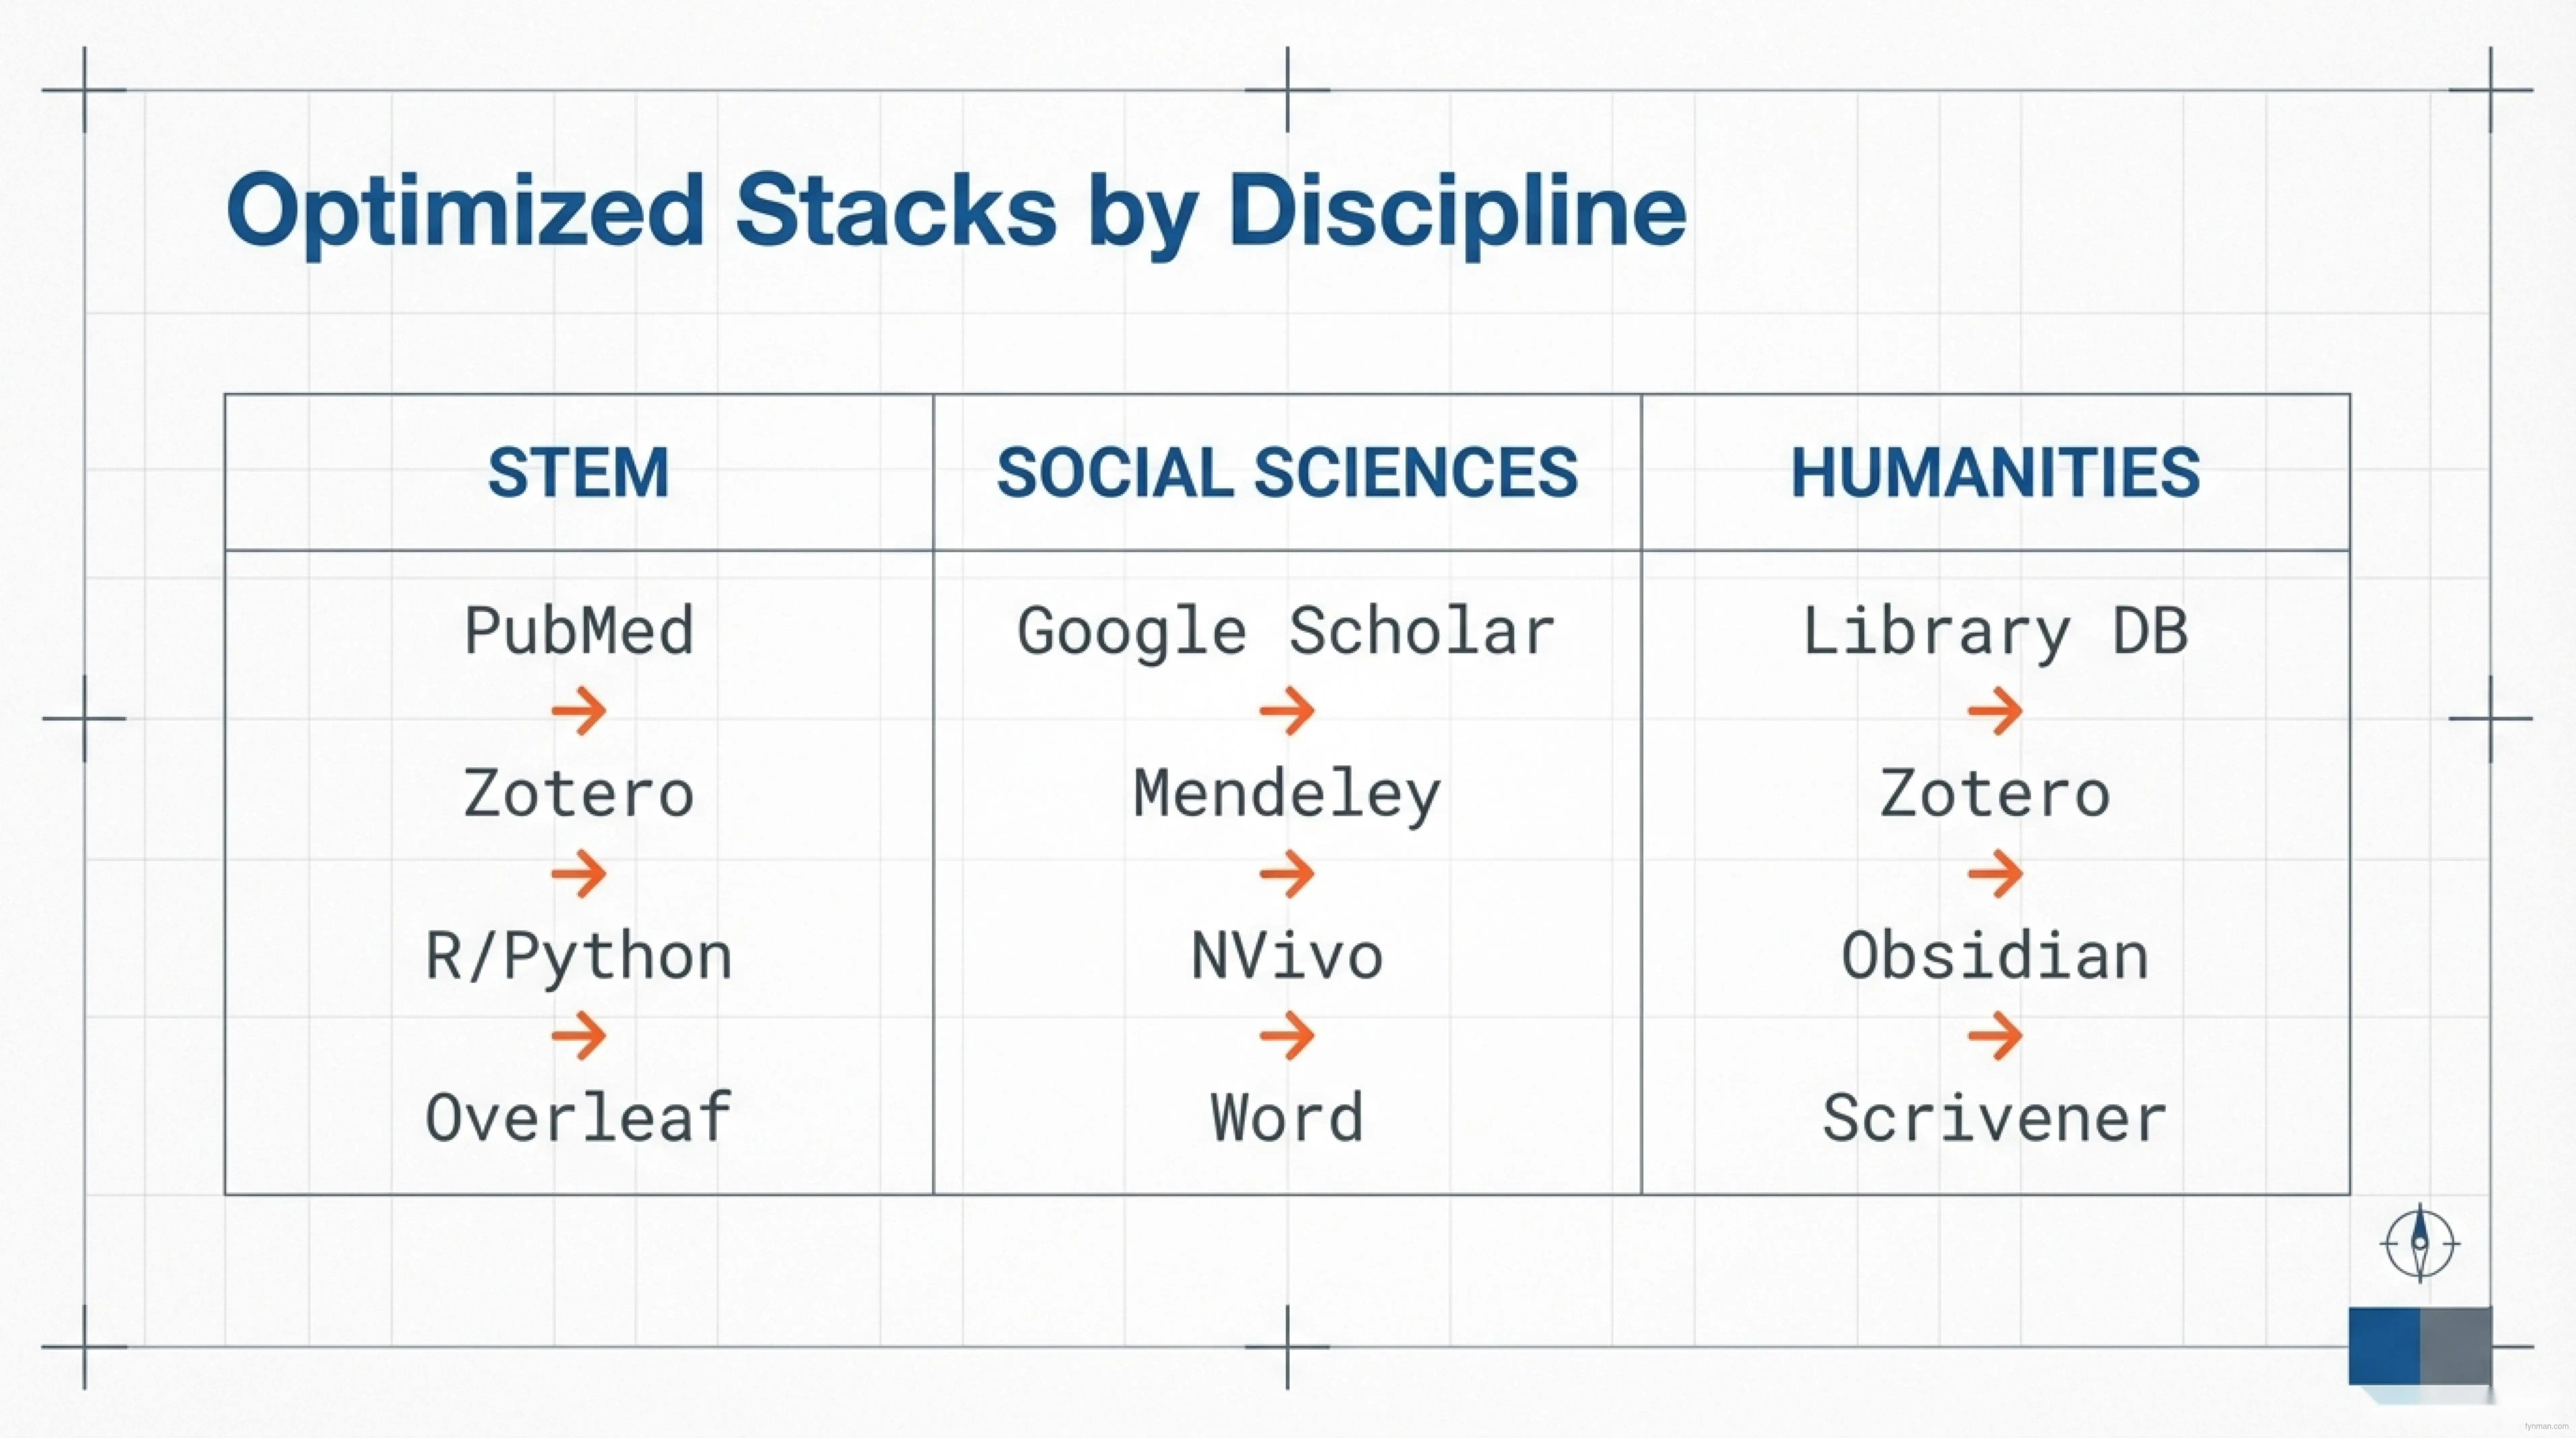
Different fields have different tools and workflows. Here’s what works for each.
STEM Stack (Biology, Physics, Chemistry, Engineering)
STEM research requires tools that handle complex equations, reproducible analysis, and figure-heavy papers. Your stack starts with PubMed (for biomedical work) or arXiv (for physics and math) for discovery. From there, use Zotero (free) or Mendeley (more polished interface) as your reference hub. For reading, SciSpace offers AI-powered summarization, or use Fynman—which integrates discovery, reading, synthesis, and note-taking into one sovereign research workspace. Take notes in R or Python notebooks so computation and documentation live together. Write in Overleaf (LaTeX) if your journals require it, or Word if your lab prefers it. Analysis happens in R or Python with reproducible scripts.
The handoff sequence flows like this: PubMed → Zotero (via browser extension) → Fynman (for paper screening and synthesis) → R notebook (where analysis happens) → Overleaf → automatic bibliography. Why? PubMed’s search is optimized for biological literature. Zotero handles thousands of papers without slowing. Fynman’s integrated approach keeps reading and thinking in one place instead of jumping between tools. R notebooks keep code and documentation together. Overleaf integrates Zotero natively, so citations populate automatically.
Social Sciences Stack (Psychology, Sociology, Economics, Political Science)
Social science research combines qualitative and quantitative methods, draws from diverse databases, and relies heavily on argumentative context. Start with Google Scholar for discovery (it indexes across databases better than discipline-specific tools). Use Mendeley for your reference hub—its interface is more intuitive for social scientists who work across disciplines. For reading and synthesis, Fynman excels at extracting arguments and claims from papers while keeping your thinking in one sovereign research workspace. Take notes in NVivo if you’re doing qualitative coding, or Obsidian if you prefer personal synthesis notes. Write in Word because journals expect .docx files and the annotation process matters in social sciences. Analysis splits into two paths: NVivo for qualitative work, R or Python for quantitative studies.
The handoff sequence is: Google Scholar → Mendeley → Fynman → NVivo (qualitative) or R (quantitative) → Word → automatic bibliography. This order works because Google Scholar casts a wider net than discipline-specific databases. Mendeley’s interface matches how social scientists think. Fynman’s integrated approach means you’re not jumping between separate reading and synthesis tools. NVivo is the standard for qualitative analysis across the discipline. Word remains universal in social science publishing.
Humanities Stack (Literature, History, Philosophy, Classics)
Humanities research draws from diverse sources—books, primary documents, archives—and builds narrative arguments through deep contextualization. You’ll find sources through library databases like JSTOR and Project MUSE, or the Library of Congress. Use Zotero as your reference hub because it handles books and diverse source types better than tools designed for journal articles. Read and take notes in Obsidian, whose linked notes mirror how humanistic thinking works (one idea connects to many others, not in a linear sequence). Write in Scrivener if you’re composing longer manuscripts, or Word if your institution prefers it. The synthesis is manual—there’s no algorithm for humanistic argument—but it’s thoughtful and textured.
The handoff sequence looks like: Library database → Zotero → Obsidian (linked, networked notes) → Scrivener (organize your outline) → Word or Scrivener (final draft) → automatic bibliography. This order works because library databases index archival materials and journals together. Zotero captures books and diverse types. Obsidian’s networked structure lets you build arguments by connecting ideas across sources. Scrivener handles the complexity of long manuscripts with multiple sections and revisions. The synthesis process is where you do your best thinking.
Action Plan: Build Your Integrated Workflow in 3 Steps
You don’t need to rebuild everything today. Start with your biggest pain point and expand from there.
Step 1: Audit Your Current Workflow
Be honest about where your workflow breaks. Where do you lose insights—during reading, note-taking, or when you sit down to write and can’t remember where you found something? Where do you switch contexts most? Are you jumping between tools 10 times a day? Which stage feels most broken—discovery, organization, synthesis, or analysis?
Common pain points map to specific stages. If you lose track of papers, your Stage 3 (reference management) needs fixing. If your notes don’t connect, Stage 4 (note-taking) is broken. If writing takes forever because you can’t find sources, you need integration between your reference manager and Word (Stage 5). If you have insights scattered across 50 PDFs, you need to centralize note-taking (Stage 4).
Step 2: Fix One Link Today
Don’t rebuild the entire system. Pick one broken handoff and fix it. Let’s say your biggest pain is citing papers while writing. Right now, you’re in Word, you need a source, you dig through Zotero to find the citation, you copy-paste it, it’s formatted wrong, you fix it—10 minutes later you’re back to writing. After fixing this link, you’re in Word, you type the author name in the Zotero plugin, the citation appears formatted correctly, and you’re back to writing in 10 seconds.
To fix this (takes 30 minutes): Install Zotero or Mendeley or EndNote. Install the Word plugin. Add 5 papers to your reference manager via the browser extension. Insert a citation in a test Word document using the plugin. See it work. That’s one link fixed. The time you save compounds immediately.
Step 3: Test for Two Weeks, Iterate Once
Use your new workflow for 14 days without other changes. Then measure three things: Are you switching contexts less frequently? Are your insights flowing more naturally into writing? Are you spending less time hunting for papers or sources?
If yes—the tool works. Add the next tool. Maybe it’s networked notes. Maybe it’s AI-powered reading. One addition per sprint.
If no—the tool didn’t solve the problem. Try a different tool for that stage. Don’t assume you’re doing something wrong. Assume the tool doesn’t fit your workflow. Real behavioral change takes time. You’ll feel slower in week one. By week two, you’ll see the benefits. Two weeks is the minimum cycle length.
FAQ: The Questions Every Researcher Asks
The Bottom Line: Build Systems, Not Tool Collections
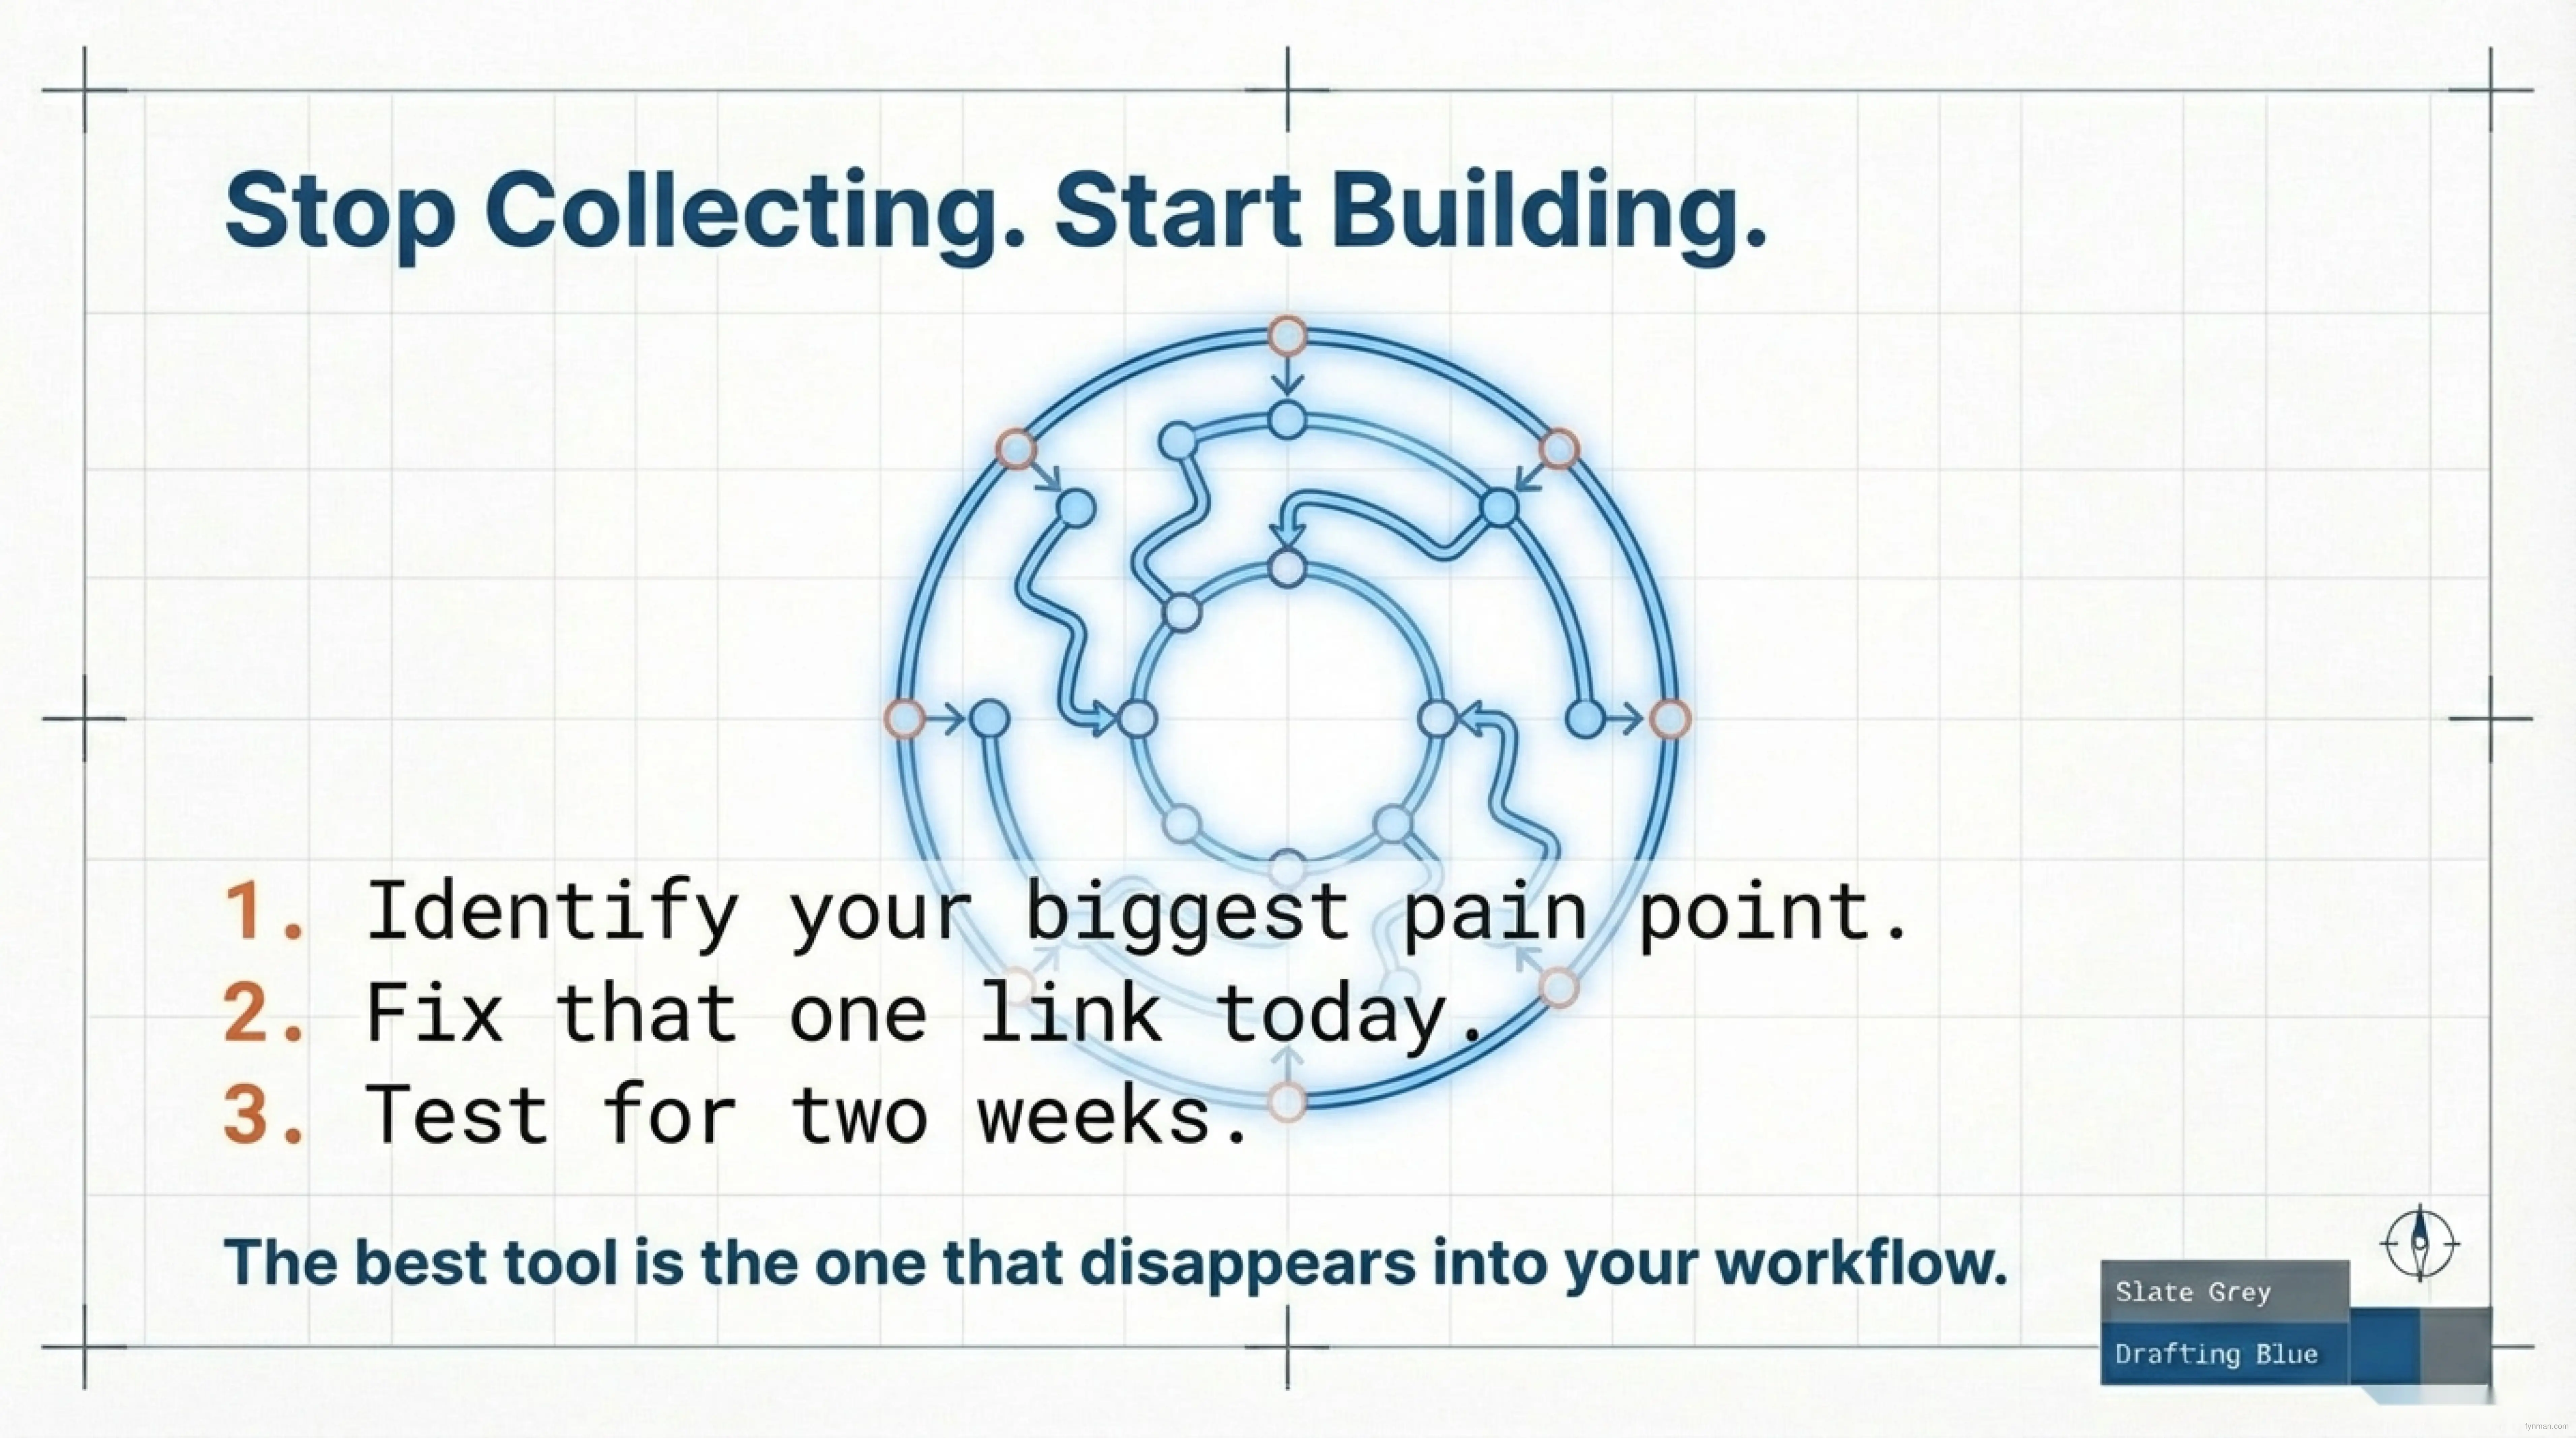
You don’t have 12 tools because you’re disorganized. You have 12 tools because you haven’t built a system connecting them. The researchers who feel most productive aren’t using the fanciest tools. They’ve built a resilient pipeline where:
- Discovery flows to reference management automatically
- Reference management feeds into reading seamlessly
- Reading generates notes that synthesize into insights
- Insights flow directly into writing without friction
- Writing connects to citations without manual work
- Analysis produces reproducible, publication-ready results
- Feedback from advisors and reviewers loops back to refine your research
Notice that last point: the human feedback loop. The best systems account for iteration, supervisor input, and collaborative refinement. Don’t build a system so automated that it excludes the human thinking that makes research valuable.
Some researchers integrate these themselves with 4-5 point tools. Others use a single integrated workspace that handles discovery through writing. The structure varies. The principle is the same: resilient connections between stages, human judgment at every step, and ownership of your data.
That’s a system. It’s not complicated. Start with your biggest pain point. Fix one link today. Test for two weeks. Add the next piece. The best tool is the one that disappears into your workflow. The best system is the one you don’t think about—you just do research.
Ready to Build Your System
Identify your discipline (STEM, Social Sciences, or Humanities). Find the specific tools and setup steps for your field above. Pick your first pain point and fix it this week. Come back in two weeks and add the next piece.
If you’re looking for a platform that integrates discovery, reading, synthesis, and writing into one sovereign research workspace—where you own your insights and your workflow flows naturally—explore Fynman. It’s designed around this exact architecture.
Your research is too important to waste on tool juggling.
Frequently Asked Questions
Find answers to common questions about this topic.